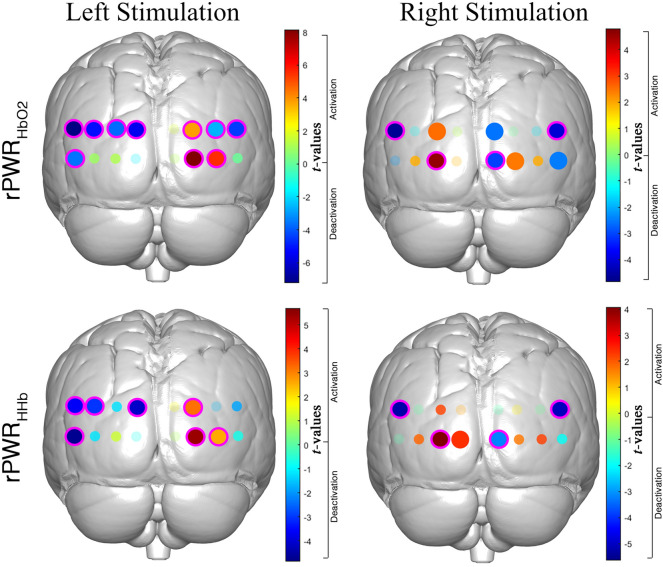
Figure 5.
t-values activation maps resulting from the group-level one sample t-test against zero performed on the rPWRHbO2 (top) and rPWRHHb (bottom). t-maps are presented for the Right (right) and Left (left) stimulation conditions. Positive t-values correspond to a positive association between HbO2/HHb and oxCCO (i.e., channels with a greater increase in HbO2 and oxCCO/greater decrease in HHb and increase in oxCCO) and negative t-values correspond to a negative association between HbO2/HHb and oxCCO (i.e., channels with a greater decrease in HbO2 and oxCCO/greater increase in HHb and decrease in oxCCO). Small shaded circles represent non-significant channels (p > 0.05), solid big circles represent significant channels (p < 0.05), and magenta circles indicate the significant channels (p < 0.05) surviving the FDR correction.

