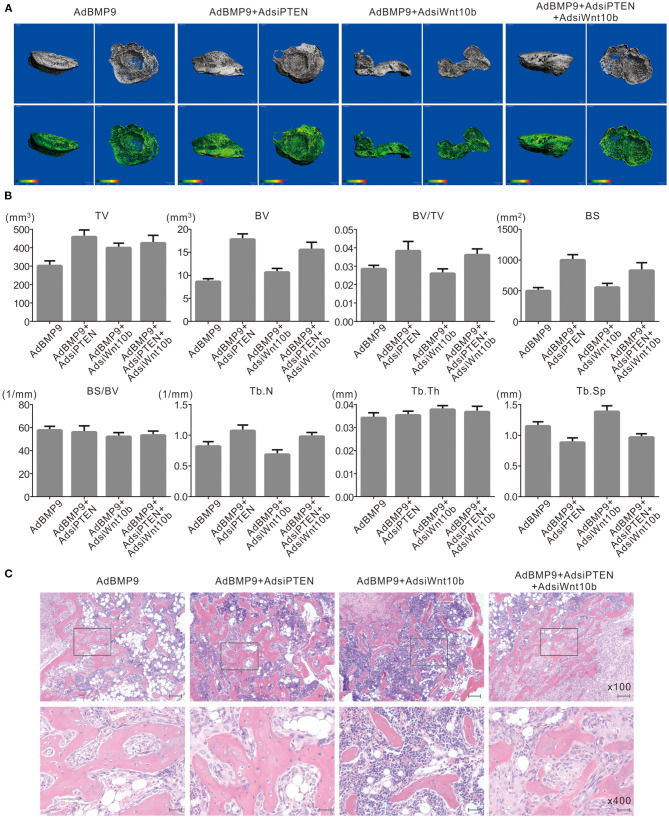
Figure 4.
Effects of Wnt10b and PTEN on BMP9-induced osteogenesis in C3H10T1/2 cells. (A) 3-D reconstruction of μ-CT scanning results shows the effect of silencing Wnt10b and/or PTEN on BMP9-induced bone formation in C3H10T1/2 cells (representative data are shown). (B) Quantitative analysis μ-CT scanning results show the effect of silencing Wnt10b and/or silencing PTEN on BMP9-induced bone formation in C3H10T1/2 cells (TV, total volume; BV, bone volume; BS, bone surface area; Tb.N, trabecular number; Tb.Th, trabecular thickness; Tb.Sp, trabecular separation). (C) H and E staining results show the effect of silencing Wnt10b and/or PTEN on BMP9-induced bone formation in C3H10T1/2 cells (Scale is 200 μm for upper panel; scale bar is 50 μm for lower panel).

