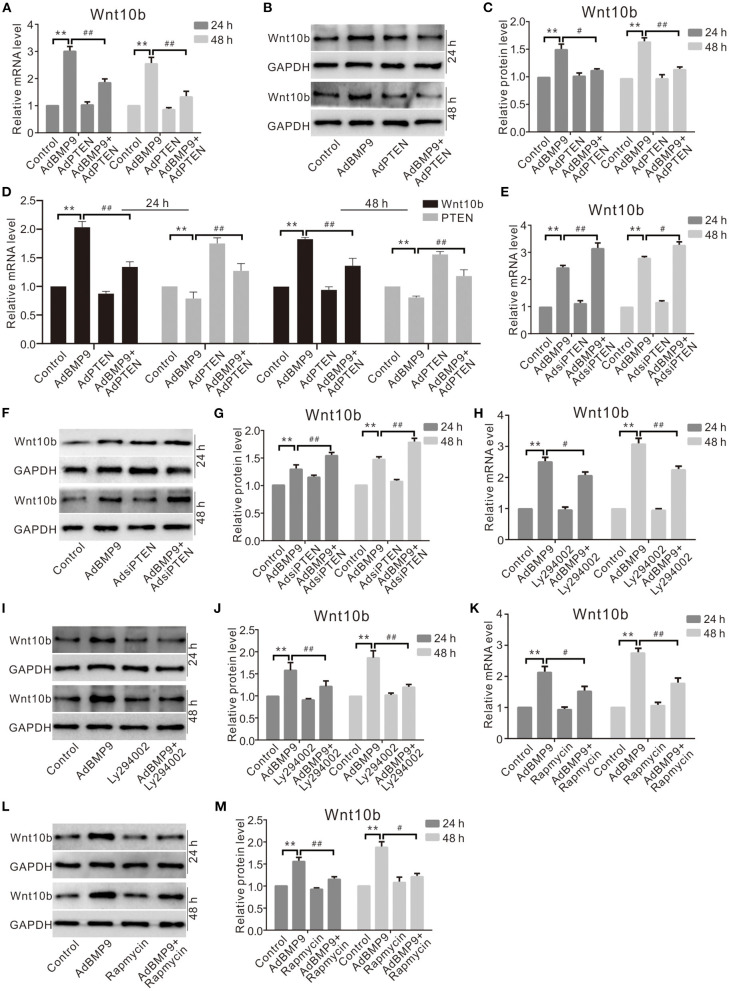
Figure 5.
Effects of PTEN, PI3K, or mTOR on Wnt10b induced by BMP9 in C3H10T1/2 cells. (A) Real-time PCR assay shows the effect of PTEN and/or BMP9 on Wnt10b in C3H10T1/2 cells (**p < 0.01 vs. control; #p < 0.05 and ##p < 0.01 vs. groups treated with BMP9 only). (B) Western blot assay shows effects of PTEN and/or BMP9 on Wnt10b in C3H10T1/2 cells. (C) Quantification of Western blot assay shows effect of PTEN and/or BMP9 on Wnt10b in C3H10T1/2 cells (**p < 0.01 vs. control; ##p < 0.01 vs. groups treated with BMP9 only). (D) Real-time PCR results show the effect of exogenous PTEN and/or BMP9 on Wnt10b in C3H10T1/2 cells as well as PTEN (**p < 0.01 vs. control). (E) Real-time PCR assay shows the effect of PTEN knockdown and/or BMP9 on Wnt10b in C3H10T1/2 cells (**p < 0.01 vs. control; ##p < 0.01 vs. groups treated with BMP9 only). (F) Western blot assay shows the effect of PTEN knockdown and/or BMP9 on Wnt10b in C3H10T1/2 cells. (G) Quantification of Western blot assay shows the effect of PTEN knockdown and/or BMP9 on Wnt10b in C3H10T1/2 cells (**p < 0.01 vs. control; #p < 0.05 and ##p < 0.01 vs. groups treated with BMP9 only). (H) Real-time PCR assay shows effects of Ly294002 and/or BMP9 on Wnt10b in C3H10T1/2 cells (**p < 0.01 vs. control; ##p < 0.01 vs. groups treated with BMP9 only). (I) Western blot assay shows the effect of Ly294002 and/or BMP9 on the level of Wnt10b in C3H10T1/2 cells. (J) Quantification of Western blot assay shows effects of Ly294002 and/or BMP9 on Wnt10b in C3H10T1/2 cells (**p < 0.01 vs. control; ##p < 0.01 vs. groups treated with BMP9 only). (K) Real-time PCR assay shows the effect of rapamycin and/or BMP9 on Wnt10b in C3H10T1/2 cells (**p < 0.01 vs. control; ##p < 0.01 vs. groups treated with BMP9 only). (L) Western blot assay shows the effect of rapamycin and/or BMP9 on Wnt10b in C3H10T1/2 cells. (M) Quantification of Western blot assay shows effect of rapamycin and/or BMP9 on Wnt10b in C3H10T1/2 cells (**p < 0.01 vs. control; #p < 0.05 and ##p < 0.01 vs. groups treated with BMP9 only).

