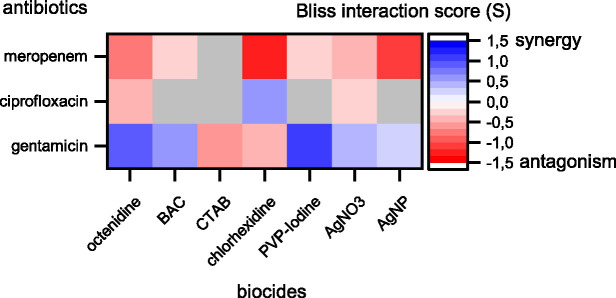
Figure 2.
Synergy and antagonism between antibiotics and biocides based on Bliss interaction scores. Red colors depict antagonistic and blue colors depict synergistic interactions. Combinations displayed in colors were significant according to a one-sample t-test (p < 0.05). Combinations displayed in gray were not significant. Note that our assay cannot fully exclude synergy or antagonism for those combinations shown in gray. These interactions might be detectable if more combinations of different concentrations are tested.

