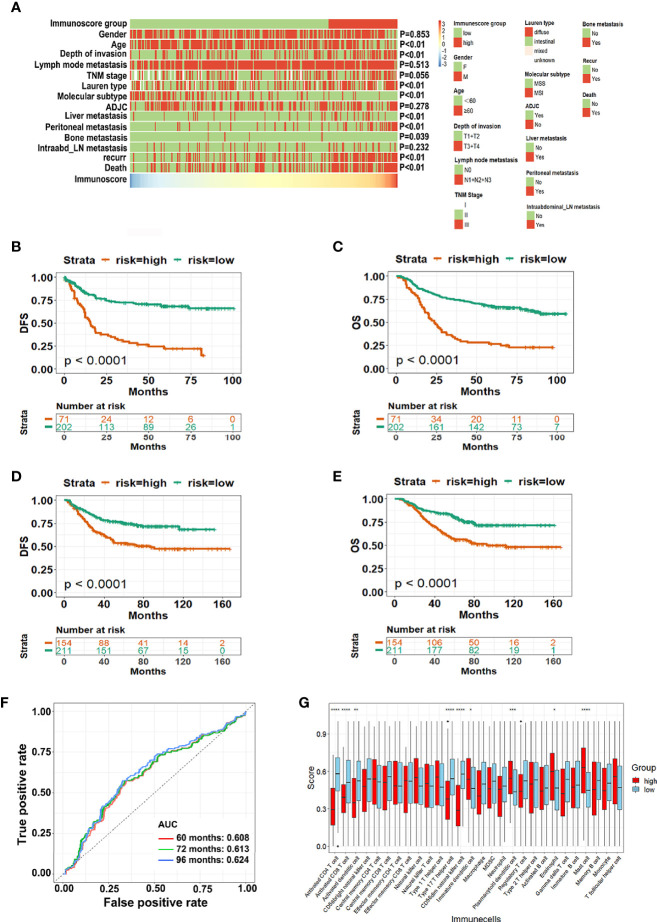
Figure 3.
The predictive value of IS for GC patients with surgery. (A) Heatmaps summarizing the distribution of IS and clinical pathological characteristics in the training cohort; (B, C) Kaplan-Meier analysis for the DFS and OS of GC patients in the GSE62254 dataset; (D, E) Kaplan-Meier analysis for the DFS and OS of GC patients in the GSE26253 dataset; (F) The IS measured by time-dependent ROC curves in the testing cohort. The area under the ROC curve was defined as AUC; (G) Distribution of 28 immune cells transformed using ssGSEA in high-IS and low-IS groups. ADJC, adjuvant chemotherapy; Intraabd_LN intraabdominal lymph nodes; DFS, disease free survival; OS, overall survival; GC, gastric cancer; ssGSEA single-sample gene set enrichment analysis; IS, immunoscore; ROC, receiver-operating characteristic. *P < 0.05; **P < 0.01; ***P < 0.001; ****P < 0.0001.

