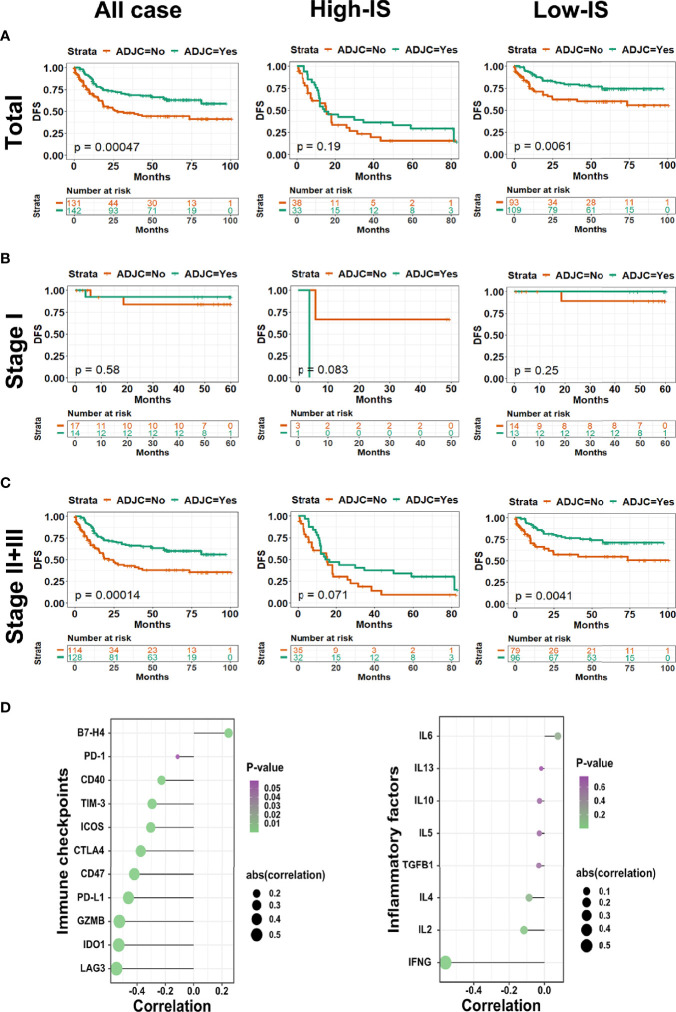
Figure 5.
Comparing adjuvant chemotherapy benefit by DFS in total and TNM stage subgroups. Kaplan-Meier curves of (A) total cohort, (B) stage I and (C) stages II and III patients with GC stratified by the receipt of adjuvant chemotherapy; (D) Bubble diagrams describing the association between IS value and immune checkpoint regulators (left pane) and inflammatory cytokines (right pane). Bubble size represents the degree of correlation, bubble color denotes P-value. DFS, disease free survival; GC, gastric cancer.

