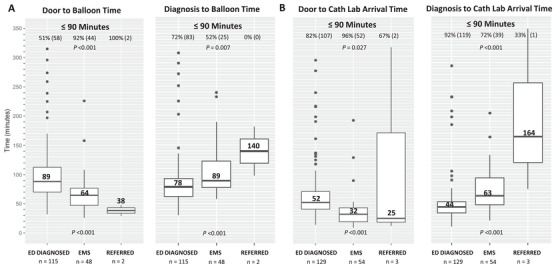
FIGURE 2.

Door versus diagnosis to treatment times for emergency department ST‐segment elevation myocardial infarction (STEMI) patients. Panel A provides side‐by‐side comparisons of door‐to‐balloon and diagnosis‐to‐balloon times for the acute STEMI patients who received percutaneous coronary intervention (PCI) whose care was facilitated by the emergency department in the form of box‐and‐whisker plots. The central dark line within each box is the median, top, and bottom of the box are the 75th and 25th percentiles, and the whiskers represent the tails of the width of the data distribution with outlier cases presented as black circles. Each measure is separated by location of diagnosis cohorts including those diagnosed with STEMI via an electrocardiogram (ECG) acquired in the PCI center ED (ED‐diagnosed), emergency medical services (EMS), or a referring facility (referred). Panel B presents an analogous, but diagnostic‐team‐centric comparison for door‐to‐cathlab‐arrival and diagnosis‐to‐cathlab‐arrival times. Sample sizes (n) include patients with available data. See Supplement IV eTable 1 for additional data detail
