Figure 1.
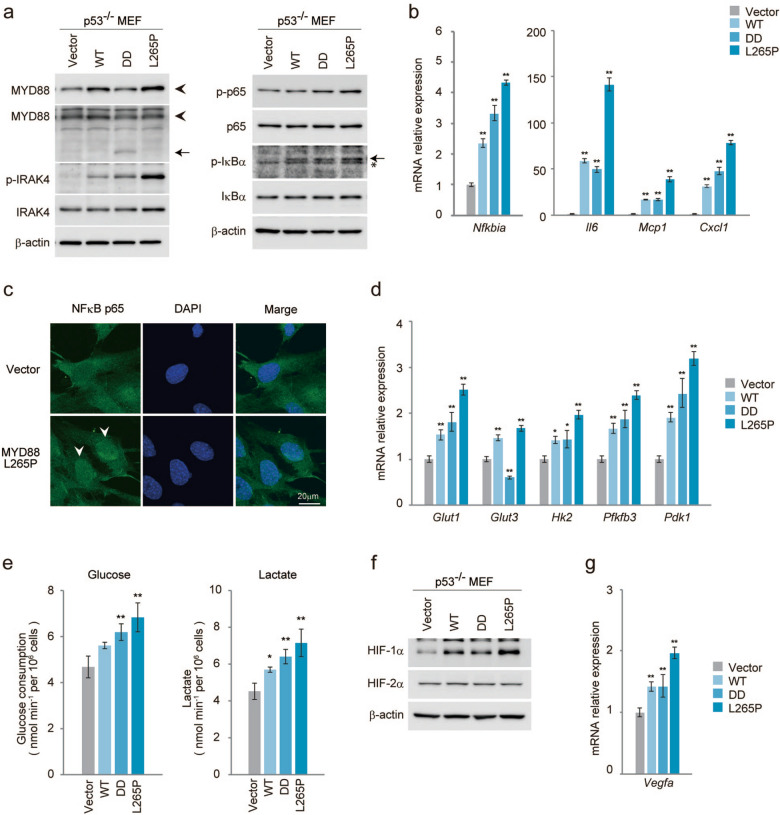
MYD88 signals activate NF-κB p65 and glucose metabolism in p53−/−MEFs. The indicated MYD88 constructs were introduced to p53−/−MEFs by retroviral infection. (a) Total cell lysate was analysed by immunoblotting. Left panel: The arrowhead indicates MYD88 and the arrow indicates truncated MYD88 (DD). Right panel: The arrow indicates phosphorylated-IκBα and the asterisk indicates a nonspecific band. All images of the original blots are shown in Fig. S9. (b) Quantitative polymerase chain reaction (qPCR) of NF-κB target genes. (c) Immunofluorescence staining shows NF-κB p65 nuclear localisation. Scale bar, 20 μm. (d) Expression of glucose metabolism-related gene mRNAs quantified by qPCR. (e) Glucose uptake and lactate production were measured. Statistical analysis was performed using one-way ANOVA followed by Scheffe’s F test. The quantified results are presented as the mean ± s.d. (n = 4). *P < 0.05, **P < 0.01 as compared with Vector. (f) Total cell lysates were analysed by immunoblotting. (g) Expression of vegfa mRNA was measured by qPCR. (b,d,g) The y-axis values are the relative fold change for gene transcripts normalised to β-actin. The data represent the mean ± s.d. (n = 3) using one-way ANOVA followed by Scheffe’s F test. *P < 0.05, **P < 0.01 as compared with Vector.

