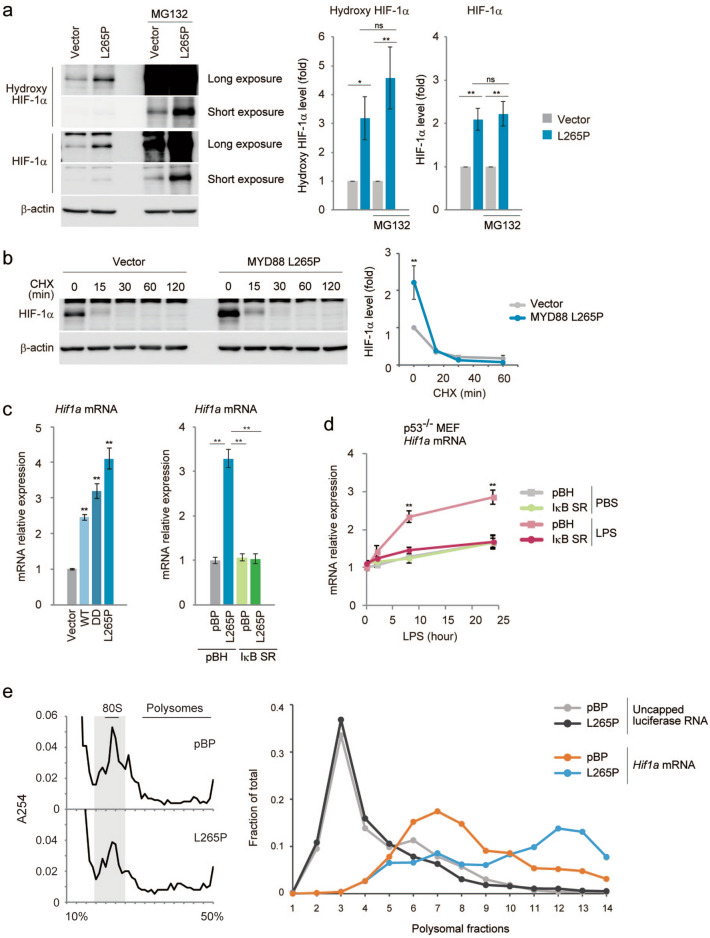
Figure 4.
Increased glucose metabolism is mediated by HIF-1α expression regulated at the transcription and translation level in MYD88-expressing p53−/−MEFs. (a) p53−/−MEFs expressing vector or MYD88 L265P were treated with 40 μM MG132 for 7 h. Total cell lysates were analysed by immunoblotting (left). Protein expression was quantitated using ImageJ software and the respective protein blots are shown in the graph (right). (b) p53−/−MEFs expressing vector or MYD88 L265P were treated with 100 μg/ml cycloheximide (CHX) for the indicated times. Total cell lysates were analysed by immunoblotting (left) and the quantification of HIF-1α signals is shown (right). (c) Hif1a mRNA expression was quantified in the indicated cells by qPCR. (d) p53−/−MEFs were stimulated with 100 ng/ml LPS for 2, 8, and 24 h. Expression of Hif1a mRNA was quantified by qPCR. (e) Polysomal fractionation was performed for p53−/−MEF expressing vector or MYD88 L265P to detect Hif1a mRNA translation efficiency. The sucrose gradient was 10–50% and 15 fractions were collected. The OD254 plot for each polysome profiling experiment (left). The relative distribution of Hif1a mRNA associated with each fraction of the gradient was analysed by qPCR (right). The uncapped luciferase RNA was added as an exogenous control, which was not associated with ribosomes and remained in the top fraction. (c,d) The y-axis values are relative fold change for gene transcripts normalised to β-actin. Data represent the mean ± s.d. (n = 3). (a–d) The data represent the mean ± s.d. using one-way ANOVA followed by Scheffe’s F test. *P < 0.05, **P < 0.01.

