Figure 6.
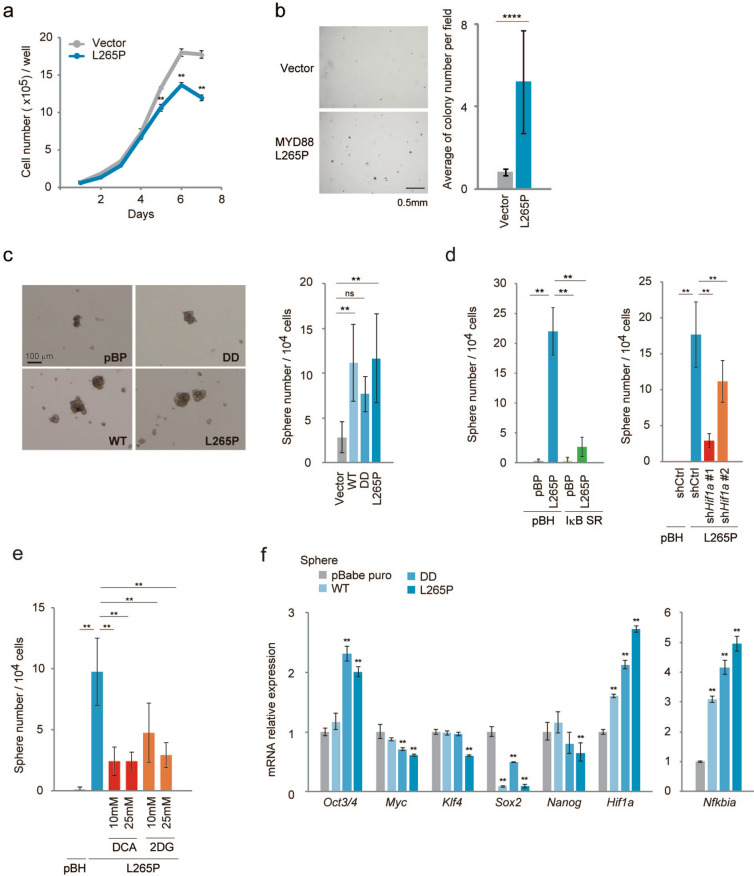
Spheres from p53−/−MEFs expressing activated MYD88 constructs express Oct3/4 genes. (a) A cell growth assay was performed using the indicated cells. Cell numbers were counted every day between day 0 and day 7 (n = 3). (b) Colony formation assay using stably expressing vector and MYD88 L265P constructs in p53−/− MEFs. Cells (25 × 103 per well) were seeded in soft agar and incubated for 4 weeks. Colonies with a diameter > 35 μm were counted. Left panel: representative images of the colony. Scale bars, 0.5 mm. Right panel: graphic represents three independent experiments. A two-tailed t-test was used for statistical analysis. The mean ± s.d. is shown. ****P < 0.0001. (c) Sphere formation assays were performed using stably expressing vector and MYD88 constructs in p53−/− MEFs. Left panel: representative images of spheres. Scale bars, 100 μm. Right panel: the mean number of spheres per 104 cells from three independent experiments. (d) Sphere formation assays were performed: (left) suppression of NF-κB by IκB SR; (right) reduced HIF-1α expression by shHif1a #1 and #2, in p53−/− MEFs expressing MYD88 L265P. (e) Sphere formation assays. The glucose metabolism pathway was inhibited using a PDK inhibitor dichloroacetate (DCA) and glycolysis inhibitor 2-deoxy-D-glucose (2DG), in p53−/− MEFs expressing MYD88 L265P. DCA and 2DG were used at the indicated concentrations. (c–e) Numbers of spheres with a diameter > 100 μm were counted between days 6 and 9. The quantified results are presented as the mean ± s.d. using one-way ANOVA followed by Scheffe’s F test. *P < 0.05, **P < 0.01. (f) Expression of reprogramming-related genes from spheres was quantified by qPCR. The y-axis values are the relative fold change for gene transcripts normalised to β-actin. Data represent the mean ± s.d. (n = 3) using one-way ANOVA followed by Scheffe’s F test. *P < 0.05, **P < 0.01.

