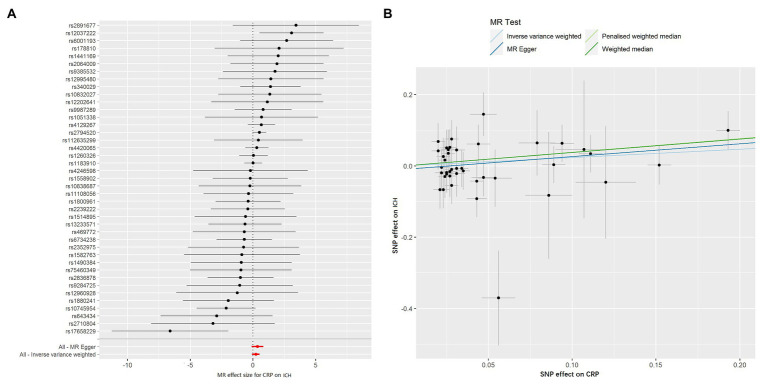
Figure 1.
Forest plots and scatter plots of CRP-associated SNPs potential effects on intracerebral hemorrhage (ICH). Forest plot (A) shows the odds ratio (OR) with a horizontal line representing 95% CI for the CRP-associated SNP allele for ICH risk. Scatter plot (B) shows the per-allele association with ICH risk plotted against the per-allele association with 1 SD of CRP (vertical and horizontal black lines presenting the 95% CI of OR for each SNP), with the slope of each line corresponding to estimated Mendelian randomization (MR) effect per method.

