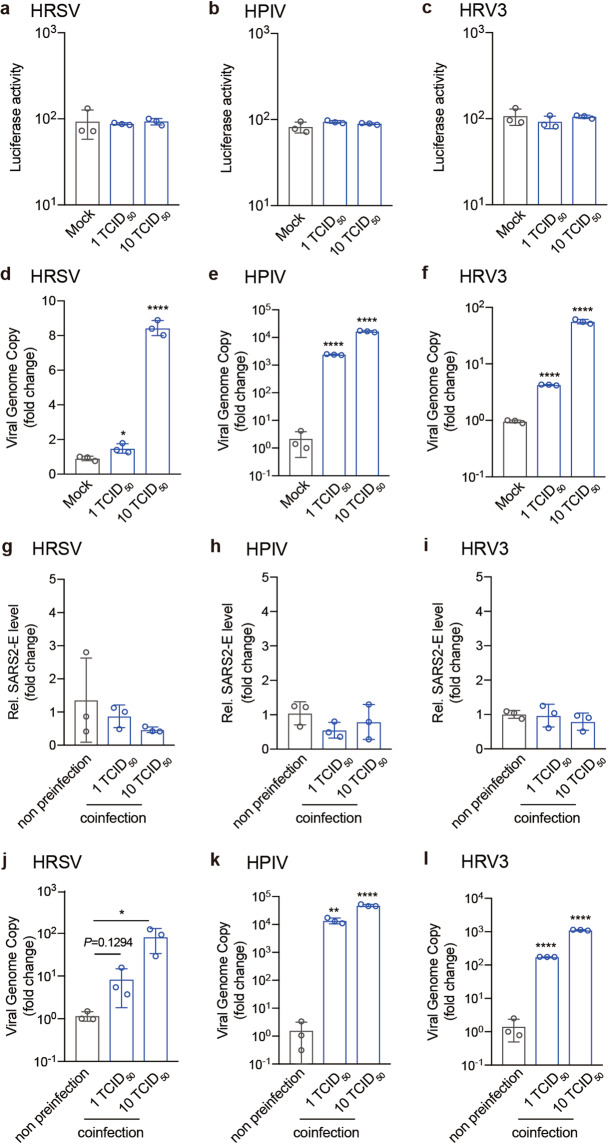
Fig. 3. SARS-CoV-2 infection in response to HRSV, HPIV, or HRV3.
a–c A549 cells were preinfected with HRSV, HPIV, or HRV3 at the indicated doses for 12 h. Cells were then infected with pseudo-SARS-CoV-2 for another 24 h followed by measurement of luciferase activity. d–f The propagation of HRSV (d), HPIV (e), or HRV3 (f) in A549 cells was measured by qRT-PCR 12 h.p.i. targeting the individual viral genes respectively. g–i A549 cells were preinfected with HRSV (g), HPIV (h), or HRV3 (i) at the indicated doses for 12 h. Cells were then infected with live SARS-CoV-2 for another 48 h followed by measurement of SARS-CoV-2 E gene copies via Taqman-qRT-PCR. j–l The propagation of HRSV (j), HPIV (k), or HRV3 (l) in A549 cells was measured at 60 h.p.i. by qRT-PCR targeting the individual viral genes respectively. The data are expressed as fold changes relative to the non-preinfection group. Values represent means ± SD of three independent experiments. *P < 0.05, **P < 0.01, ***P < 0.001, ****P < 0.0001.

