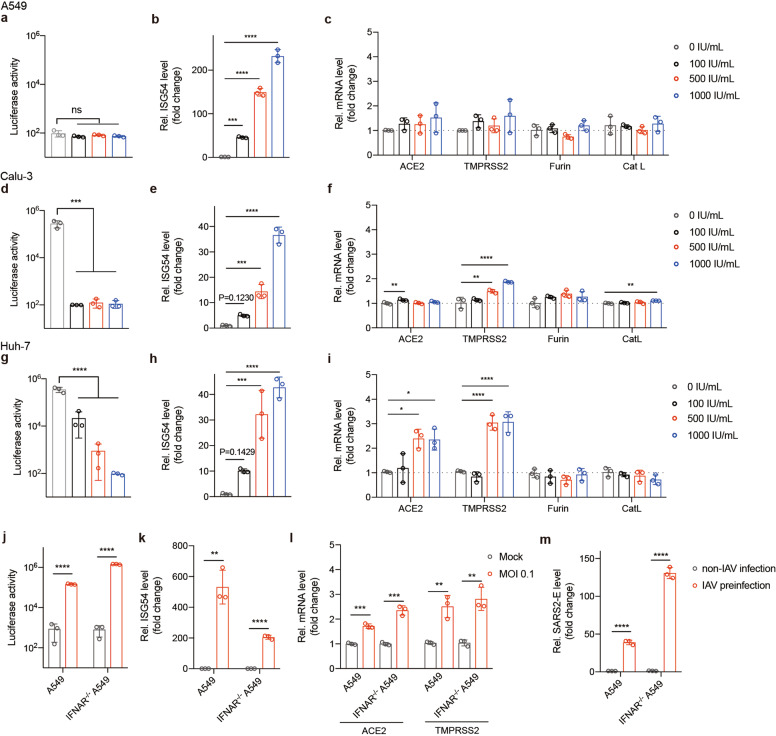
Fig. 5. Enhanced SARS-CoV-2 infection is independent of IFN signaling.
A549 (a–c), Calu-3 (d–f), and Huh-7 (g–i) cells were pretreated with the indicated doses of IFNα for 12 h. Cells were then infected with pseudo-SARS-CoV-2 for another 24 h, followed by measurement of luciferase activity and the mRNA expression levels of the indicated genes. The mRNA levels are expressed as fold changes relative to nontreated cells. P values are from unpaired one-way ANOVA. j–l WT A549 and IFNAR IFNAR–/– A549 cells were infected with WSN at an MOI of 0.1 for 12 h, and cells were then infected with pseudo-SARS-CoV-2 for another 24 h, followed by measurement of luciferase activity and the mRNA expression levels of the indicated genes. m WT A549 and IFNAR–/– A549 cells were infected with WSN at an MOI of 0.1 for 12 h, and the cells were then infected with live SARS-CoV-2 for another 48 h, followed by measurement of mRNA levels for SARS-CoV-2 E gene (Taqman-qRT-PCR). The data are expressed as fold changes relative to the nontreatment (b, c, e, f, h, i) or mock infection (k, l) or non-IAV infection (m) controls. Values represent means ± SD of three independent experiments. *P < 0.05, **P < 0.01, ***P < 0.001, ****P < 0.0001.

