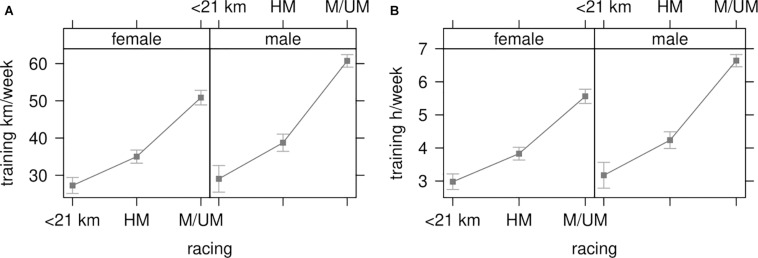
FIGURE 2.
(A) Training interaction: race distance subgroup and sex by weekly mileage. (B) Training interaction: race distance subgroup and sex by weekly duration. Results are presented as mean effect sizes with bars displaying 95% confidence interval adjusted by sex and diet. <21 km, less than half marathon; HM, half marathon; M/UM, marathon/ultra-marathon; km, kilometers; h, hours.

