FIGURE 3.
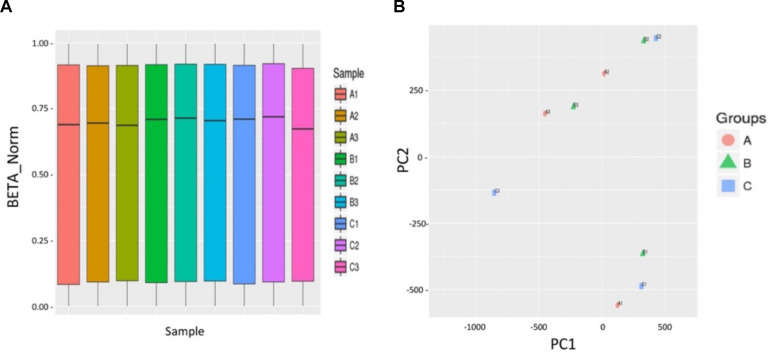
The culture and activation process of ovarian tissue in vitro did not cause abnormal DNA methylation. (A) No significant differences in total genome DNA methylation between three groups of human ovarian tissues were observed: normal group A (A1, A2, A3) (normal human ovarian fragment), control group B (B1, B2, B3) (treated with culture media only), and activated group C (C1, C2, C3) (treated with 10 μM activator MHY1485). The abscissa indicates the nine sample names, and the ordinate represents the methylation level (standardized beta value). (B) The PCA chart indicates the similarity between the samples by the method of decreasing dimensions. The three groups did not cluster together, indicating that the similarity of the samples within the same group was poor, and there were no significant differences between the three groups. | Delta Beta| ≥ 0.12 (P < 0.01) is used to screen out the different sites, Delta Beta ≥ 0.12 indicates that the degree of methylation is increased, and Delta Beta ≤ –0.12 indicates that the degree of methylation is decreased. Three volcano plots between groups show the differential of the methylation sites.

