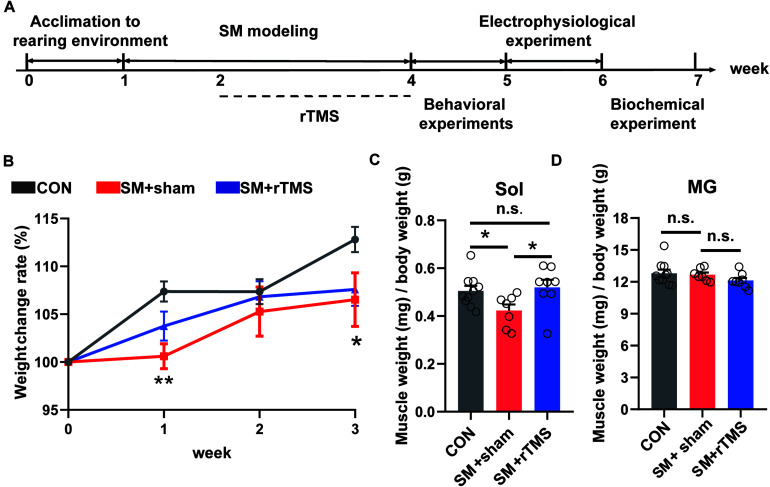
FIGURE 1.
Scheme of the experimental design and effects of rTMS on body weight and muscle weight in SM rats. (A) Scheme of the experimental design. The experimental groups were divided into control (CON, n = 10), simulated microgravity for 3 weeks with sham stimulation for 2 weeks (SM+sham, n = 7) and simulated microgravity for 3 weeks with rTMS for 2 weeks (SM+rTMS, n = 8). Behavioral experiments include open field, swimming, and gait analysis experiments. Biochemical experiments include HE staining and western blot experiment. (B) The broken-line graph shows the weight change rate of rats during the modeling period. (C) Relative mass of Sol muscle. Sol, soleus. (D) Relative mass of MG muscle. MG, musculus gastrocnemius. Error bars indicate mean ± SEM. *p < 0.05; **p < 0.01; n.s., no significant, one-way ANOVA.

