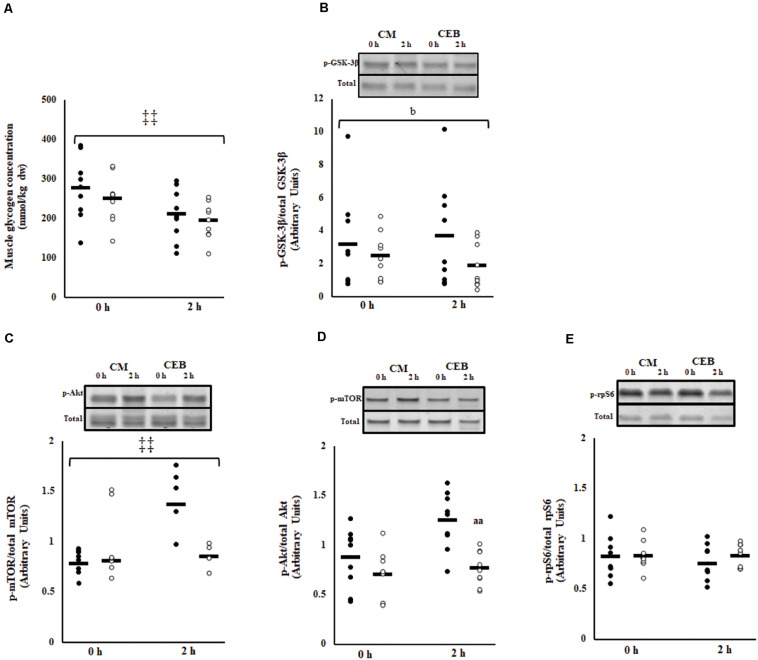
FIGURE 5.
Muscle glycogen content (A), phosphorylated GSK3-β to total GSK3-β (B), ratio of phosphorylated mTOR to total mTOR (C), phosphorylated Akt to total Akt (D), and phosphorylated rpS6 to total rpS6 (E) after 2 h HIIT exercise in temperate ambient conditions and consumption of a chocolate dairy milk (CM: ■) or the carbohydrate-electrolyte (CEB: □) recovery beverage. Mean and individual responses (n = 9): MEOTrial ‡‡ P < 0.01, bP < 0.05 vs. CM in magnitude, aaP < 0.01 vs. CM.

