Figure 2.

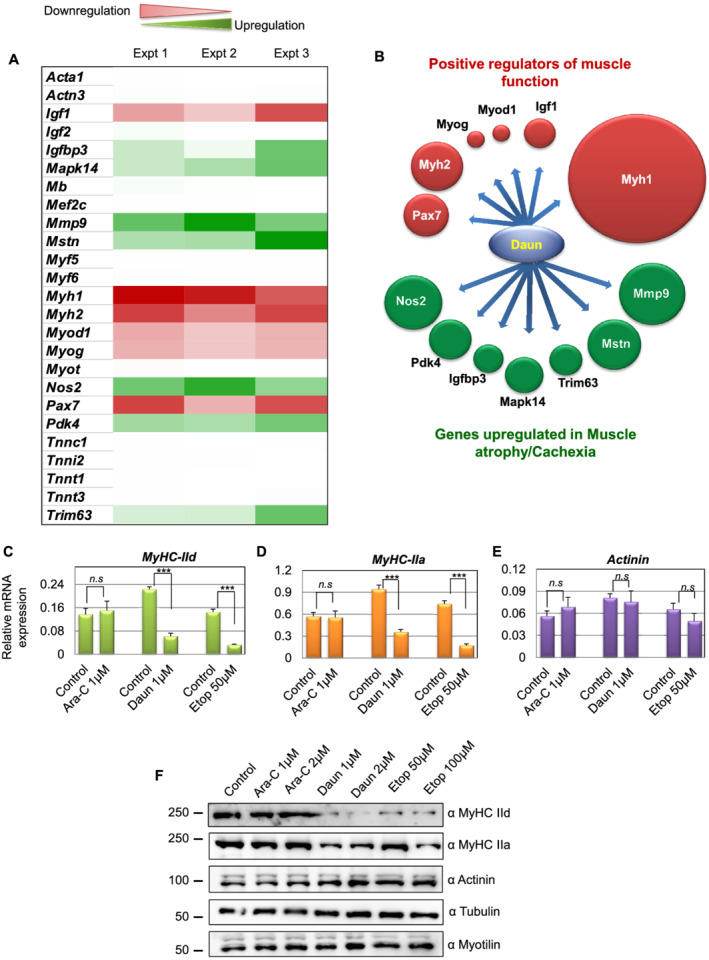
Chemotherapeutic drugs daunorubicin (Daun) and etoposide (Etop) alter gene expression of key muscle‐specific gene, specifically the Myh1 (MyHC‐IId). (A) Differentiated myotubes were treated overnight with either control or 1 μM Daun, followed by isolation of total RNA, the cDNA preparation, and RT‐qPCR to quantify relative changes of gene expression (as indicated in the figure) in the skeletal muscle‐specific gene expression arrays. ΔΔCT method was used for data analysis. Data normalization was performed against five different housekeeping genes. The heat map illustrates extent of changes in gene expressions compared with housekeeping genes. Data from three independent experiments are presented. Red colour represents down‐regulation, and green colour shows up‐regulation of corresponding genes. (B) Schematic representation of two distinct functionally opposite clusters of regulators. The size of the spheres corresponds to the level of up‐regulation and down‐regulation relative to the highest affected gene expression, i.e. Myh1. After Daun treatment, genes necessary for muscle cell growth and function were down‐regulated (green spheres), and the genes promoting muscle atrophy were up‐regulated (red spheres). (C–E) Quantitative reverse transcription polymerase chain reaction results indicating mRNA expression of (C) Myh1, (D) Myh2, and (E) Actinin tested with independent primers. The cells were treated overnight with indicated drugs, followed by mRNA isolation and cDNA synthesis. The data represent average (± SEM) from three biological experiments with technical duplicates in each experiment. The stars indicate statistically significant changes in the expression levels, unpaired t‐test, P < 0.0001. n.s, not significant. (F) Representative western blot showing changes in expression of indicated protein levels upon cytarabine (Ara‐C), Daun, and Etop treatment. Number of experiments = 3.
