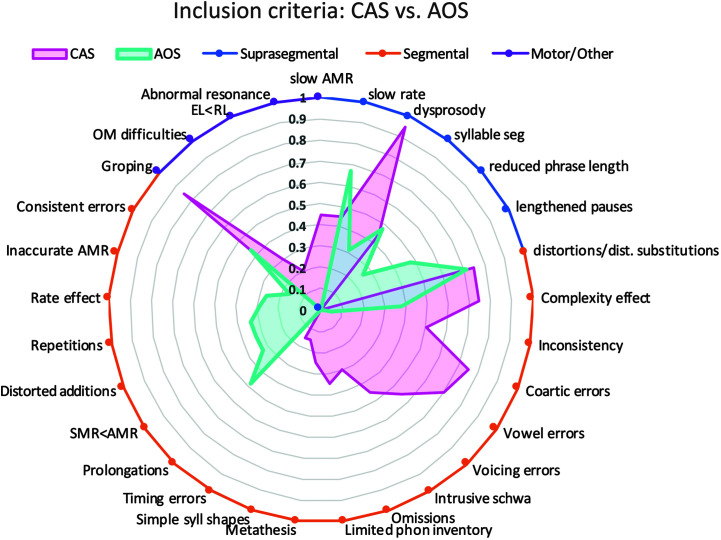
Figure 3.
Comparison of inclusion criteria in childhood apraxia of speech (CAS) studies and apraxia of speech (AOS) studies published since 2007. Frequency of occurrence of each individual inclusion criterion is represented on the radial axis as a proportion of studies using the given criterion relative to the total number of CAS (magenta) or AOS (teal) studies. Shaded areas indicate the degree of (non)overlap between features commonly used in CAS versus AOS studies. AMR = alternating motion rate; EL = expressive language; OM = oral motor; RL = receptive language; SMR = sequential motion rate.

