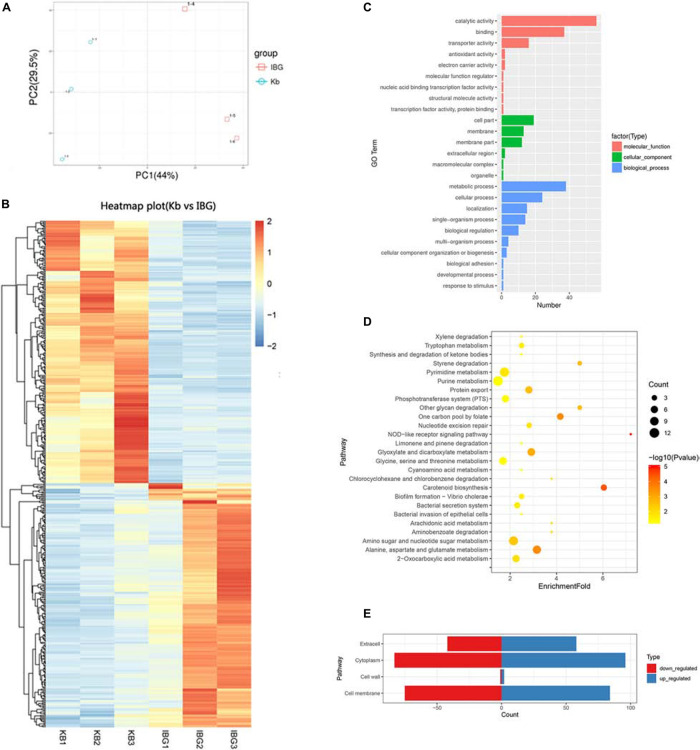
FIGURE 3.
Transcriptome analysis of DEGs in response to IBG stress. (A) PCA results. (B) Heat map representation of DEGs; (C) Go enrichment analysis of DEGs. (D) KEGG enrichment analysis of DEGs. (E) Subcellular localization of DEGs. DEGs, different expression genes; While all selected genes in RNA-seq data had FDR value of <0.05, which meant significant difference.

