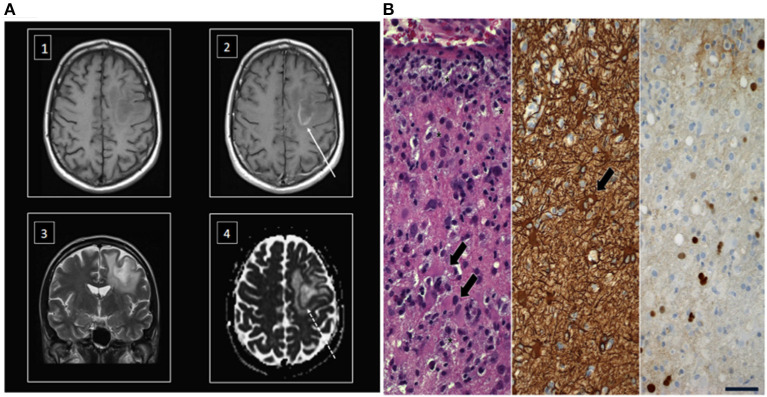
Figure 2.
MRI scan and hispathology after stereotactic brain biopsy in a representative patient with PML. (A) Superatentional cPML lesion in an immunosuppressed patient with typical moderate mass effect in relation to size of the lesion. T1 weighted imaging before (1) and after contrast administration (2) showing a centrally hypointense lesion with a slightly hyperintense rim that enhances gadolinium (arrow) (3). The lesion typically involves the subcortical U-fibers in T2 weighted images (4). The ADC map of diffusion weighted imaging showing a restricted diffusion in the region of the enhancing ring (dotted arrow) and facilitated diffusion in the rest of the lesion. (B) Left. Stereotactic biopsy revealed active inflammation with demyelination. T cell infiltrates, numerous foamy macrophages (asterisks) and reactive gliosis (arrows); middle, immunohistochemical labeling of large reactive astrocytes (arrow) with antibodies against glial fibrillary acidic protein; right, immunohistochemical demonstration of SV40 protein in scattered cell nuclei; scale = 50 μm.

