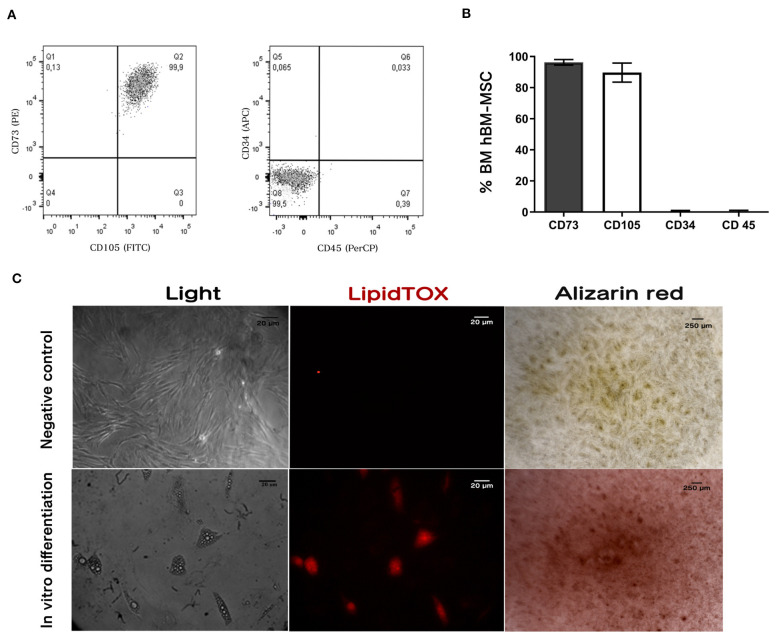
Figure 1.
hBM-MSC characterization. Immunophenotyping by flow cytometry: Dot plots (A) showing antigen expression in freshly hBM-MSC. Cells do not express hematopoietic antigens CD34 and CD45 and co-express CD73 and CD105. (B) Antigen expression quantification using flow cytometry. (C) Differentiation assay: Cultured hBM-hMSC was induced to differentiate into adipocytes and osteoblast. Adipogenic differentiation was demonstrated by lipid vacuole detection with the lipid stain LipidTOX (Middle panel); and Ca2+ deposits in osteoblast differentiation was detected with Alizarin red (right panel). Results shown represent three independent experiments done in triplicate (n = 3).

