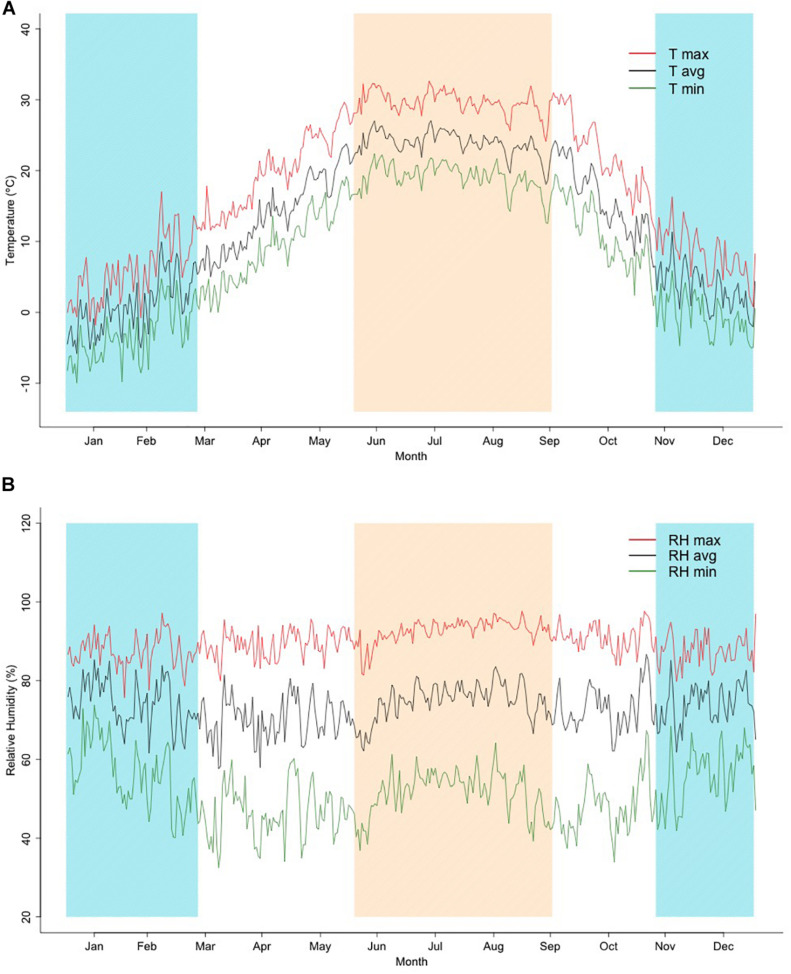
FIGURE 1.
(A,B). Average values of daily maximum (T max), average (T avg), and minimum (T min) temperatures, and daily maximum (RH max), average (RH avg), and minimum (RH min) relative humidity through the year for years 2015–2019 as used in this study. Shadowed regions represent hot (top-left to bottom-right lines) and cold (bottom-left to top-right lines) seasons.

