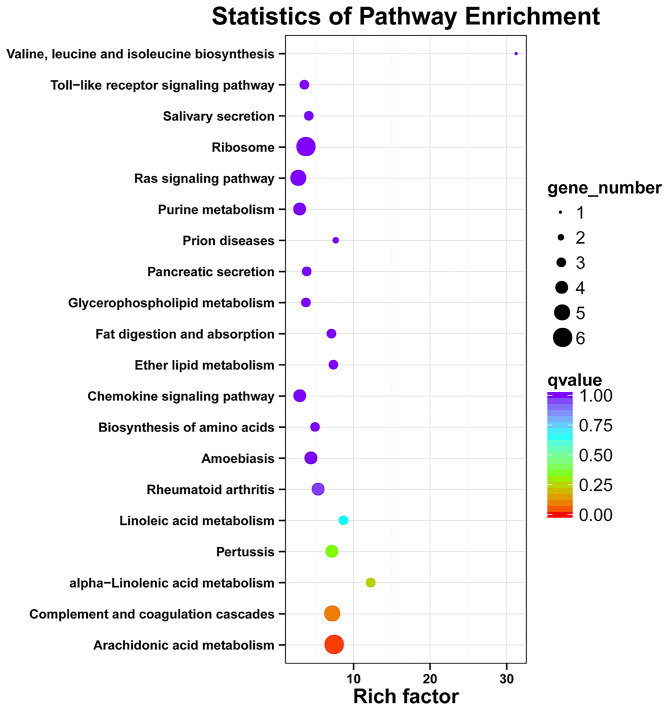
Figure 4.
KEGG enrichment analyses of the down-regulated DEGs in jejunum of neonatal goats suffering from diarrhea as compared with control goat kids. The vertical axis represents the pathway category, and the horizontal axis represents Enrichment Factor which means the proportion of DEGs annotated to the pathway on genes annotated to the pathway.

