
FIGURE 1.
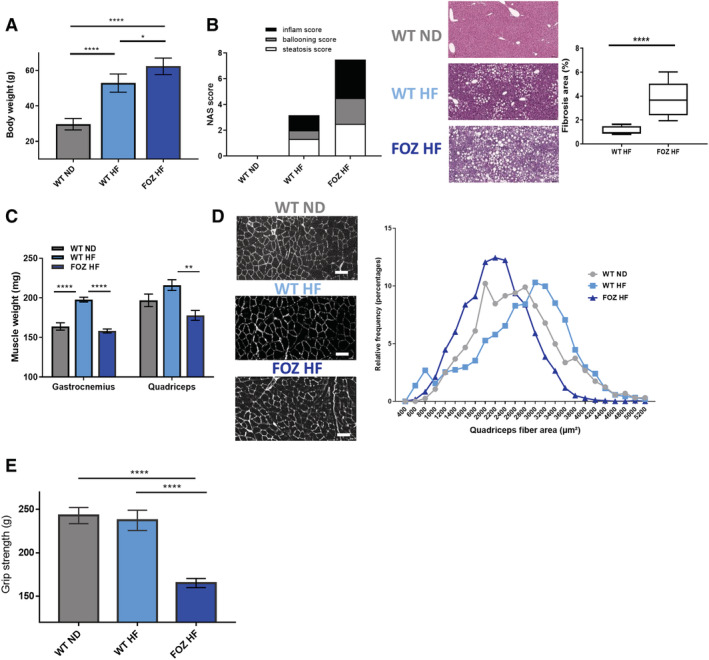
Fibrosing non‐alcoholic steatohepatitis is associated with severe muscle alterations in high‐fat (HF) diet‐fed fat aussie (FOZ HF) mice. (A) Body weight of wild‐type (WT) normal diet (WT ND), WT HF, and FOZ HF mice after 34 weeks of diet (n = 6 WT ND, n = 5 WT HF, n = 5 FOZ HF, one‐way ANOVA). (B) Left, histological non‐alcoholic fatty liver disease activity score (NAS) performed on haematoxylin and eosin (H38;E)‐stained liver sections. Center, representative histological pictures, scale bar = 100 μm. Right, fibrosis area percentage calculated on entire liver sections (n = 3–4 per group). Line, median value; box, 25–75% percentile; whiskers, min and max. (C) Gastrocnemius and quadriceps muscle weight in WT ND, WT HF, and FOZ HF (n = 6 WT ND, n = 5 WT HF, n = 5 FOZ HF, one‐way ANOVA). (D) Left, paraffin cross‐section of quadriceps with myofibers stained with wheat‐germ agglutinin (WGA). Scale bar = 50 μm. Right, histogram of relative frequency distribution (%) of myofibers size (WT ND n = 4, mean = 2632.8 ± 20.3 μm2 and median = 2579 μm2; WT HF n = 4, mean = 2749 ± 19.5 μm2 and median = 2858.5 μm2; FOZ HF n = 3, mean = 2221.8 ± 14.9 μm2 and median = 2219.3 μm2). WT ND, WT HF, and FOZ HF mean fibre sizes are all significantly different from each other with P 60; 0.0001 (one‐way ANOVA). (E) Absolute grip strength (n = 4–9 animals per group, one‐way ANOVA). All data are mean ± SEM. *P 60; 0.05, **P 60; 0.01, ***P 60; 0.001, ****P 60; 0.0001.