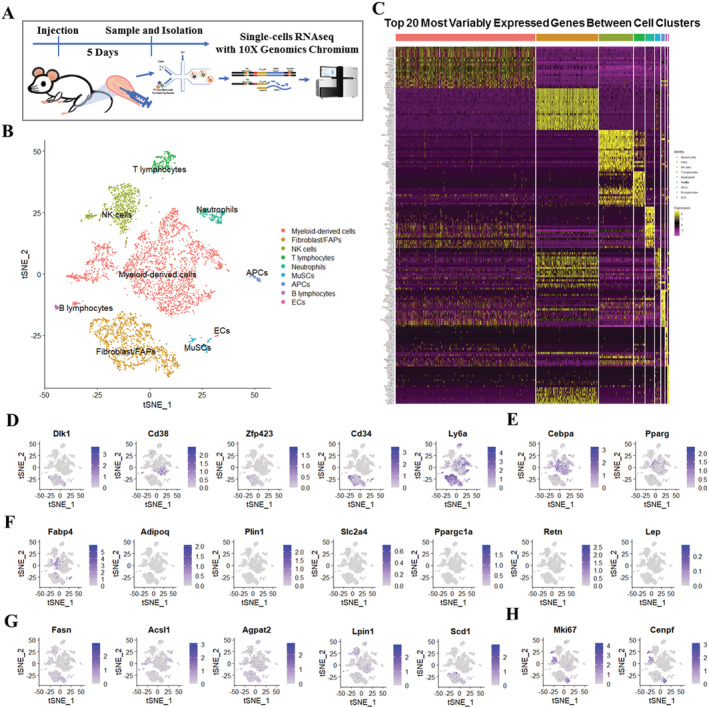
Figure 1.

scRNA‐seq identifies distinct cell populations in GLY‐injured skeletal muscle. (A) Scheme of muscle preparation, single‐cell isolation, and scRNA‐seq at 5 DPI. (B) Graph‐based clustering of isolated single cells identifies distinct clusters corresponding to different cell populations. (C) Heat map representing the top 20 most differently expressed genes between cell clusters identified. Colours and numbers correspond to the cell clusters shown in (B). Expression of (D) preadipocyte‐enriched genes (Dlk1, Cd38, Zfp423, Cd34, and Ly6a), (E) adipogenic master regulators (Cebpa and Pparg), (F) late adipogenic genes (Fabp4, Adipoq, Plin1, Slc2a4, Ppargc1a, Retn, and Lep), (G) lipogenic genes (Fasn, Acsl1, Agpat2, Lpin1, and Scd1), and (H) proliferation genes (Mki67 and Cenpf) in these populations.
