
Figure 4.
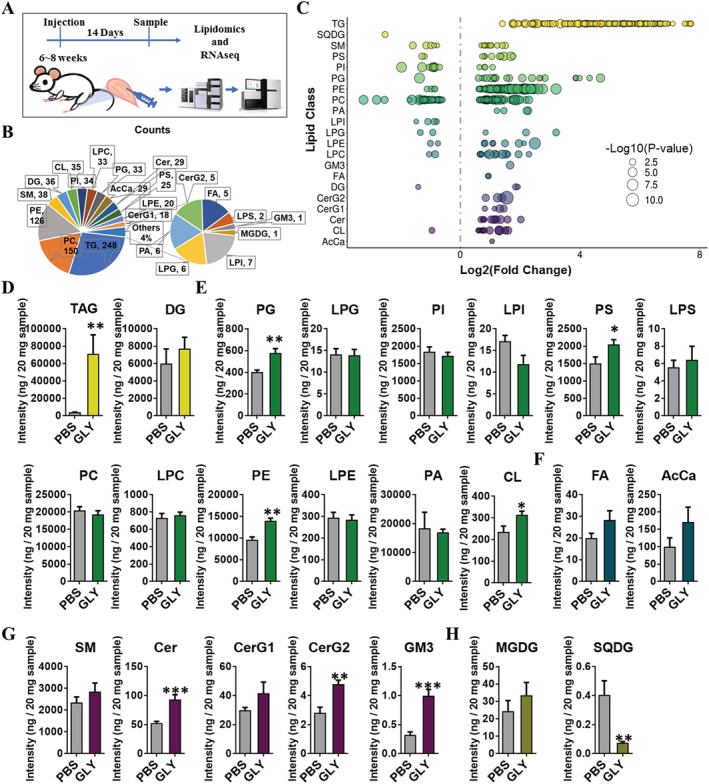
GLY‐induced IMAT infiltration changes in the overall composition of lipids in skeletal muscle. (A) Scheme of muscle preparation and lipidomic analysis of NACL‐injected or GLY‐injected TA at 14 DPI. (B) Composition of lipid classes that were considered for subsequent analysis in all of the samples detected by liquid chromatography–mass spectrometry/mass spectrometry. (C) Log2 fold changes in lipid species in NACL‐injected vs. GLY‐injected TA and the corresponding significance values displayed as −log10 (P‐value). Each dot represents a lipid species, and the dot size indicates significance. Only lipids with P < 0.05 are displayed (n = 8). The intensity fold change of (D) glycerolipids, (E) glycerophospholipids, (F) fatty acyls, (G) sphingolipids, and (H) saccharolipids in NACL‐injected vs. GLY‐injected TA. Data are presented as means ± standard error of the mean (n = 8). *P < 0.05; ***P < 0.001.