
Figure 1.
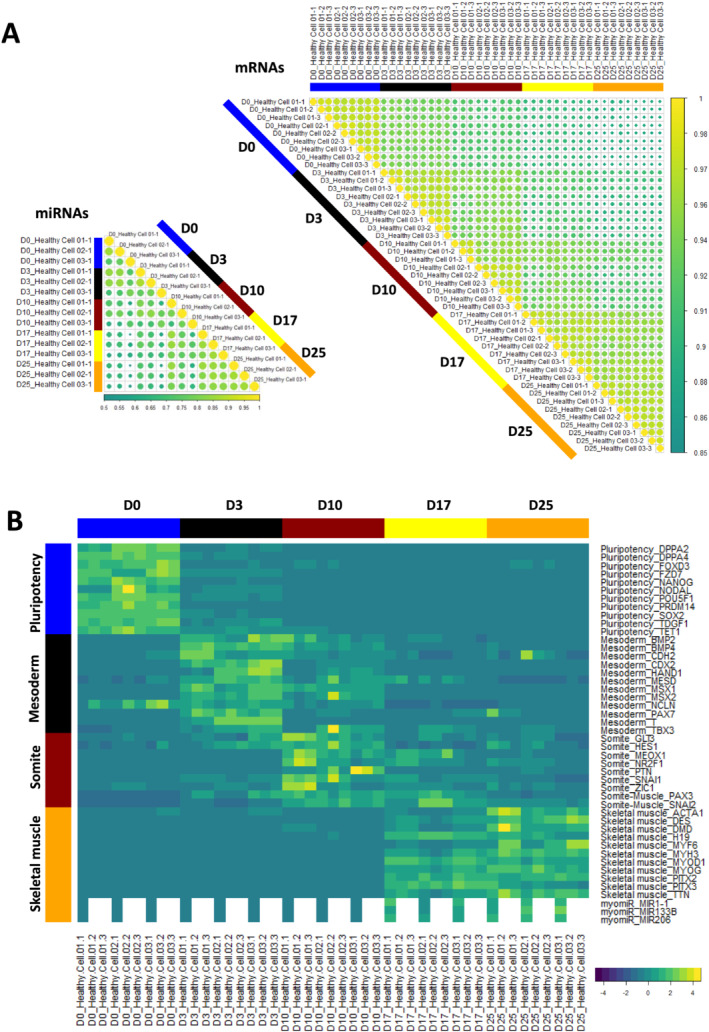
Differentiation dynamics of hiPSCs (D0) into MyoT (D25) in healthy cells at the transcriptomic level. (A) Spearman correlation matrix of transcriptomes (mRNAs, right) and miRnomes (miRNAs, left). Yellow dots indicate a stronger correlation. (B) Gene expression heatmap of selected differentiation markers (D: day; hiPSC: human induced pluripotent stem cell; MyoT: myotube).