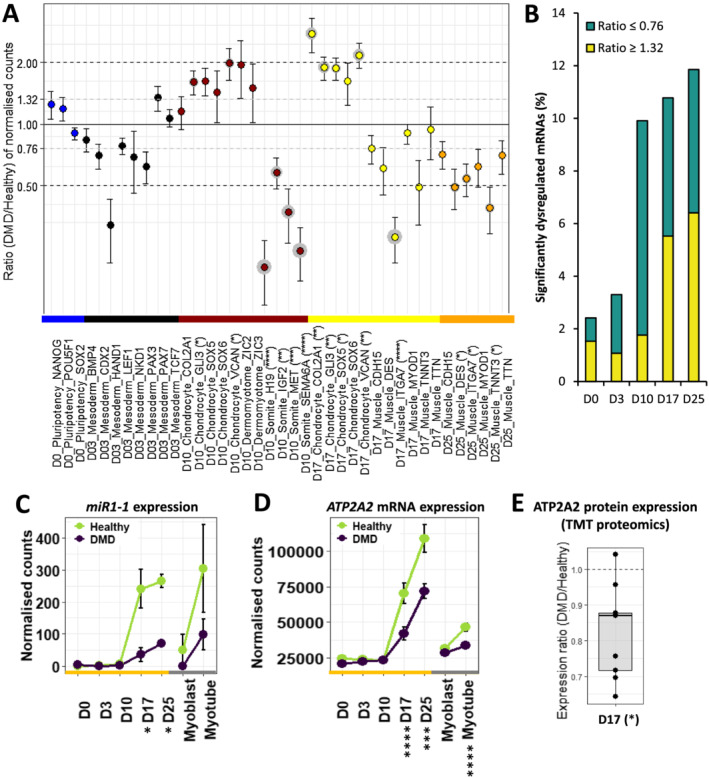
Figure 2.

Differentiation dynamics of hiPSCs (D0) into MyoT (D25) in Duchenne muscular dystrophy (DMD) cells. (A) Dotplot of DMD/healthy expression ratios of selected differentiation markers. Statistical differences are indicated in brackets after gene names and grey circles around the corresponding dots. (B) Proportions of significantly dysregulated mRNAs (adjusted P value ≤ 0.05) in DMD cells at each time point. Expression of (C) MIR1–1 and (D) ATP2A2 mRNA during differentiation. (E) ATP2A2 protein level at D17 (*adjusted P value ≤ 0.05, **adjusted P value ≤ 0.01, ***adjusted P value ≤ 0.001, ****adjusted P value ≤ 0.0001; D: day; hiPSC: human induced pluripotent stem cell; MyoT: myotube).
