
Figure 3.
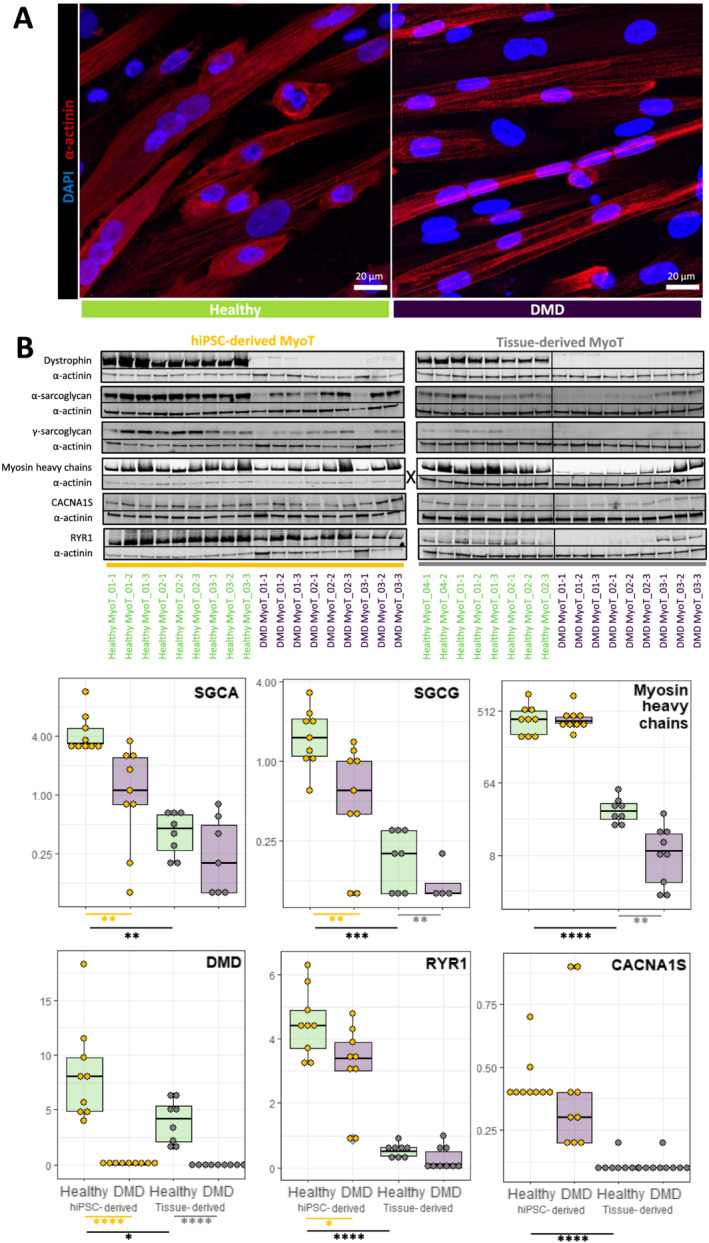
Comparison of healthy and Duchenne muscular dystrophy (DMD) MyoT from hiPSCs and tissues at the protein level. (A) hiPSC‐derived MyoT immunolabelling of α‐actinin (red) and nuclei (DAPI, blue) in healthy (left) and DMD cells (right). (B) Representative western blots and related quantifications of DMD, SGCA, SGCG, myosin heavy chains, CACNA1S, and RYR1 from protein extracts in healthy and DMD hiPSC‐derived and tissue‐derived MyoT (X: 0.25 μg of total protein was used in hiPSC‐derived MyoT instead of 7 μg in tissue‐derived MyoT—*P value ≤ 0.05, **P value ≤ 0.01, ***P value ≤ 0.001, ****P value ≤ 0.0001) (hiPSC: human induced pluripotent stem cell; MyoT: myotube).