
Figure 5.
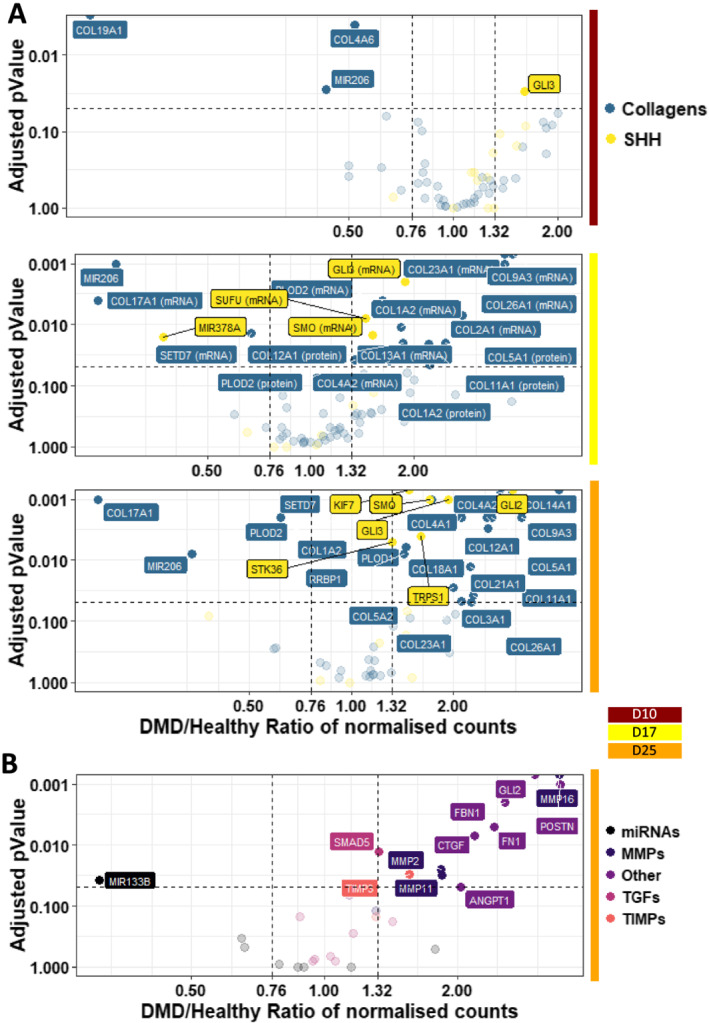
Illustration of the fibrosis phenotypes in Duchenne muscular dystrophy (DMD) cells. Volcano plots of dysregulated mRNAs/miRNAs related to (A) the SHH pathway and collagen metabolism at D10/17/25 and (B) fibrosis at D25—vertical grey dashed lines represent DMD/healthy ratio thresholds at 0.76 or 1.32, and the horizontal grey dashed line represents the adjusted P value threshold at 0.05 (D: day; MMP: matrix metallopeptidase; SHH: sonic hedgehog pathway; TIMP: tissue inhibitor of metallopeptidase; TGF: transforming growth factor).