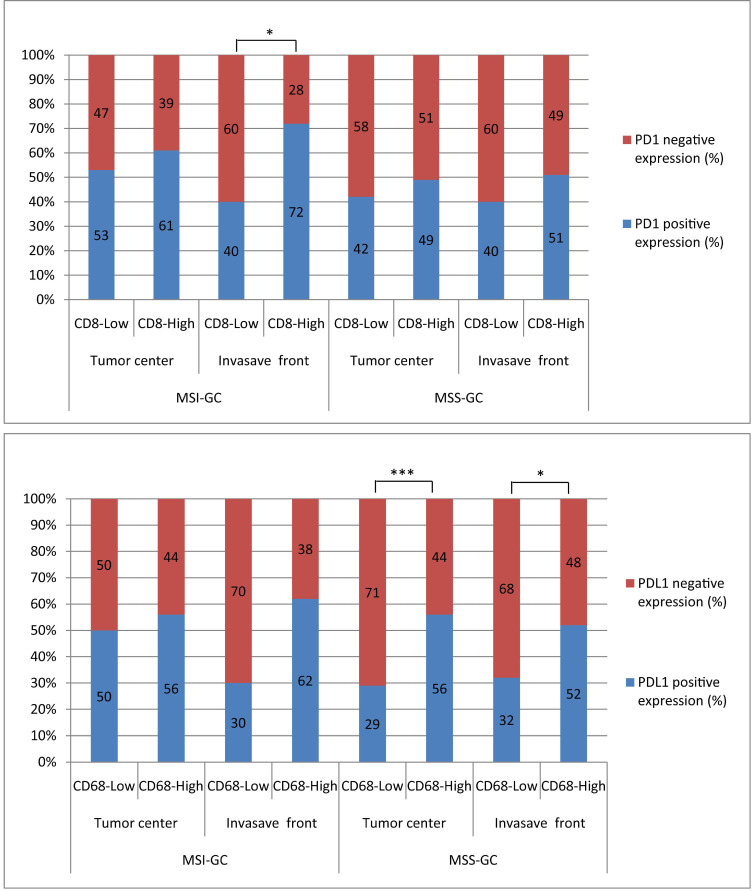
Figure 3.
The correlations between PD1/PDL1 expression and CD8+T cells/CD68+M density at different locations in MSI and MSS GC. PD1 expression was significantly related to CD8+T cells high density at invasion front of MSI GC (P=0.031). PDL1 expression was significantly related to CD68+M high density in tumor center and invasion front of MSS GC (P=0.001 and 0.014, respectively).

