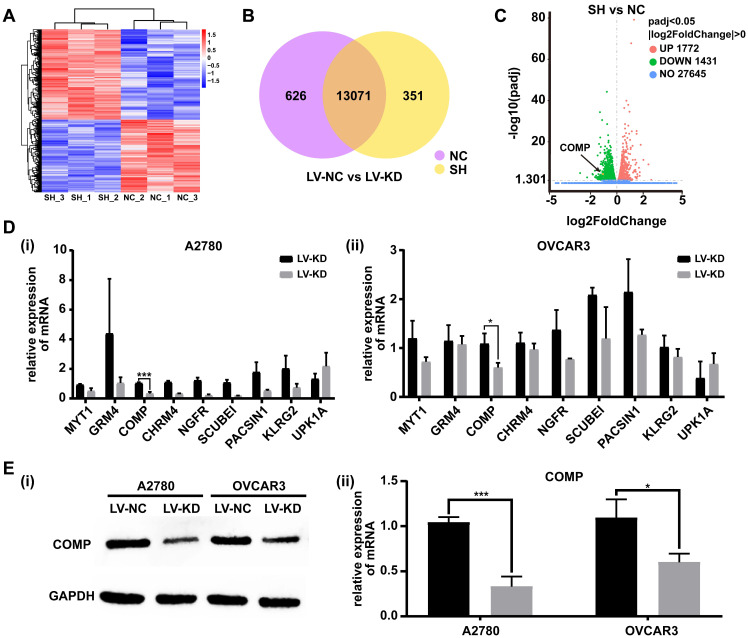
Figure 5.
SNHG25 regulates ovarian cancer progression by targeting COMP. A-C: RNA sequencing data; A: Heatmap of the most variable genes with unsupervised hierarchical clustering of samples based on RNA sequencing data, SNHG25 knockdown (n=3) and control cells (n=3); B: Venn diagram comparing differentially expressed genes (SNHG25 knockdown (n=3) vs. control cells (n=3)); C: Volcano plot of differential gene expression in SNHG25 knockdown (n=3) vs. control cells (n=3). D-E: The top nine downregulated genes in SNHG25 knockdown (n=3) vs. control cells (n=3) included MYT1, GRM4, COMP, CHRM4, NGFR, SCUBE1, PACSIN1, KLRG2, and UPK1A. D(i-ii): mRNA expression measured by qRT-PCR. E(i-ii): COMP protein expression (n(LV-NC)=3, n(LV-KD)=3). (*P<0.05, ***P<0.001).

