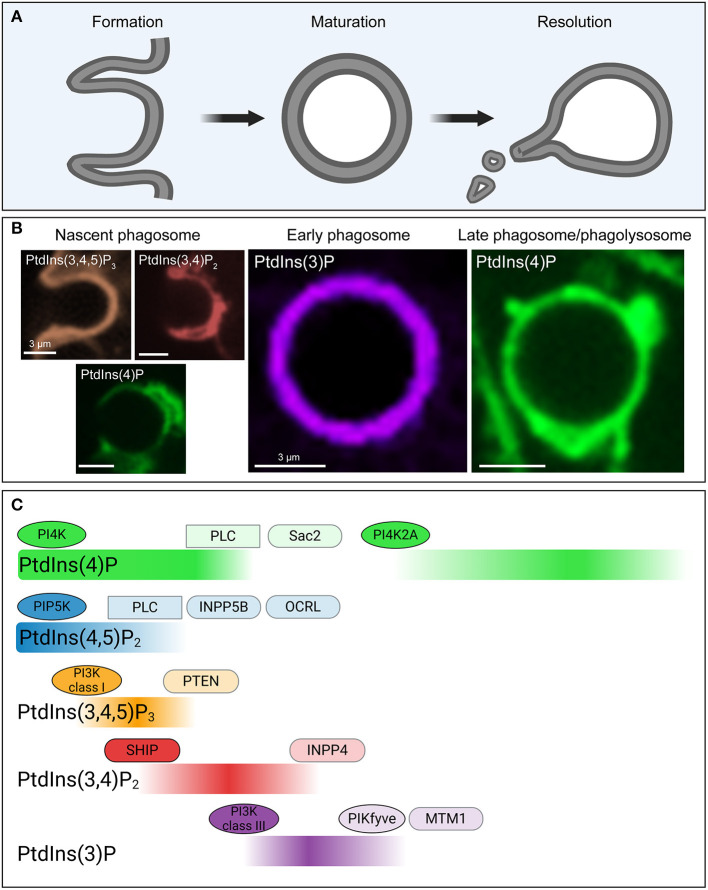
Figure 3.
Phosphoinositide fluxes drive phagosome formation, maturation, and resolution. (A) Graphic representation of the process of phagocytosis. The three main stages (phagosome formation, phagosome maturation and phagosome resolution) are depicted. (B) Representative confocal micrographs of some of the biosensors used to detect phosphoinositides during the three main stages of phagocytosis, color-coded to match (C). (C) Temporal distribution of five major phosphoinositides and the enzymes involved in their metabolism during phagosome formation, maturation and resolution. During these stages the levels of PtdIns4P (green), PtdIns(4,5)P2 (blue), PtdIns (3,4,5)P3 (orange), PtdIns(3,4)P2 (red), and PtdIns(3)P (purple) in the cytosolic leaflet of the phagosome undergo drastic changes, as indicated. These changes are mediated by a series of kinases (ovals), phosphatases (rounded rectangles/capsules), and phospholipases (rectangles) that accumulate and are activated at the phagosomal membrane at distinct timepoints during the process of phagocytosis. PI4K, phosphoinositide 4-kinase; PI3K, phosphoinositide 3-kinase; PLC, phospholipase C; SHIP, SH2 domain containing inositol polyphosphate 5-phosphatase; INPP, inositol polyphosphate phosphatase; OCRL, oculocerebrorenal Lowe syndrome protein; PTEN, phosphatase and tensin homolog; MTM, myotubularin.

