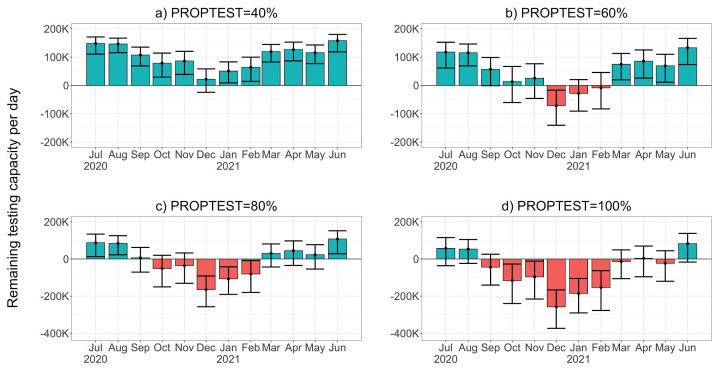
Figure 5. Remaining UK Pillar 1 and 2 testing capacity (thousands of tests) per day after testing baseline (non-COVID-19) cases of cough or fever and symptomatic COVID-19 cases in the UK each day for scenario C2.
Panels a) to d) show results for four values of the proportion of cases requesting tests (PROPTEST). Blue and red bars indicate that testing demand is within or in excess of capacity in August 2020, respectively. Note that panel a) has a different y-axis scale to panels b) - d).

