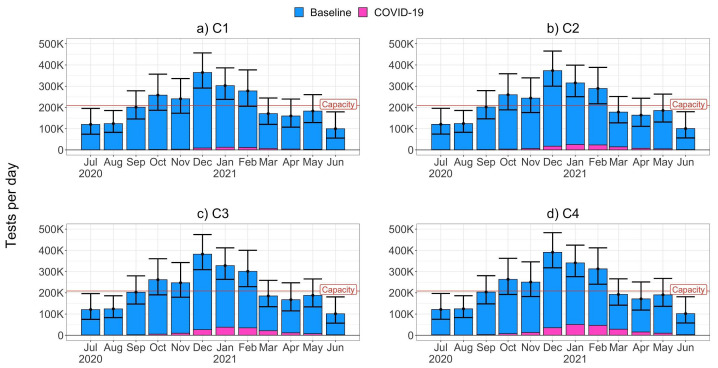
Figure 6. Predicted daily testing demand (thousands of tests) due to baseline cough or fever cases (blue) and symptomatic COVID-19 cases (pink) in the UK, assuming that 80% of cases request tests.
Panels a) to d) show results for scenarios C1 to C4. Daily UK Pillar 1 and 2 testing capacity estimates from August 2020 are marked with a red line.

