Figure 2.
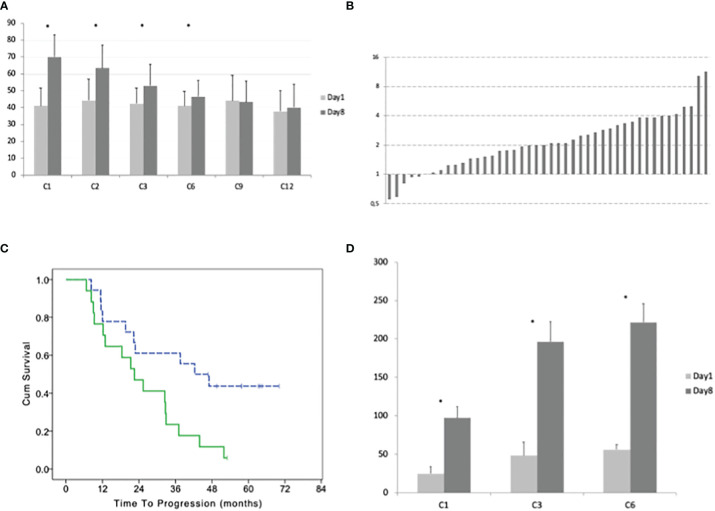
(A) Average with standard deviation of the number of γδ lymphocytes before the beginning and after 8 days of treatment at cycles: 1, 2, 3, 6, 9, and 12. (B) Ratio between the number of γδ lymphocytes at day 8 and day 1 of cycle 1 for each patient. (C) Time to progression of patients with a high and low (dotted line) percentage of γδ lymphocytes (according to the median value) in bone marrow before the beginning of the maintenance treatment. (D) Average with standard deviation of the number of CD3+ Treg lymphocytes before the beginning and after 8 days of treatment at cycles: 1, 3, and 6. Stars indicate statistically significant differences.

