Figure 3.

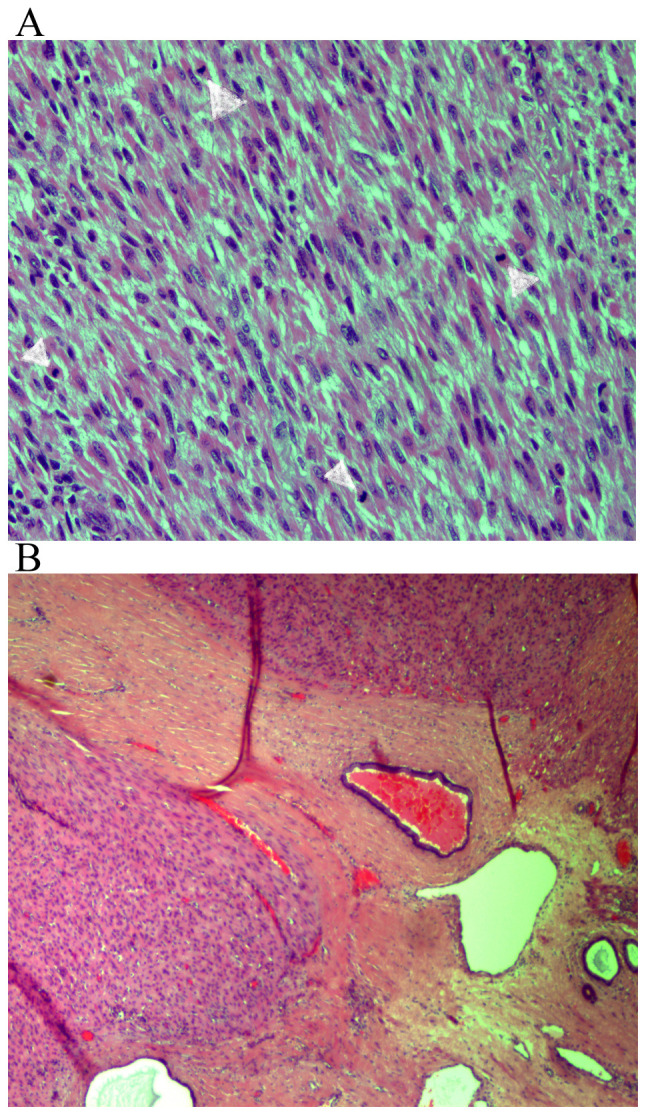
Presence of mitotic figures. (A) Hematoxylin and eosin staining of tumor tissues at a magnification of x200. (B) Focally infiltrated margin, hematoxylin and eosin staining of tissue at a magnification of x40.

Presence of mitotic figures. (A) Hematoxylin and eosin staining of tumor tissues at a magnification of x200. (B) Focally infiltrated margin, hematoxylin and eosin staining of tissue at a magnification of x40.