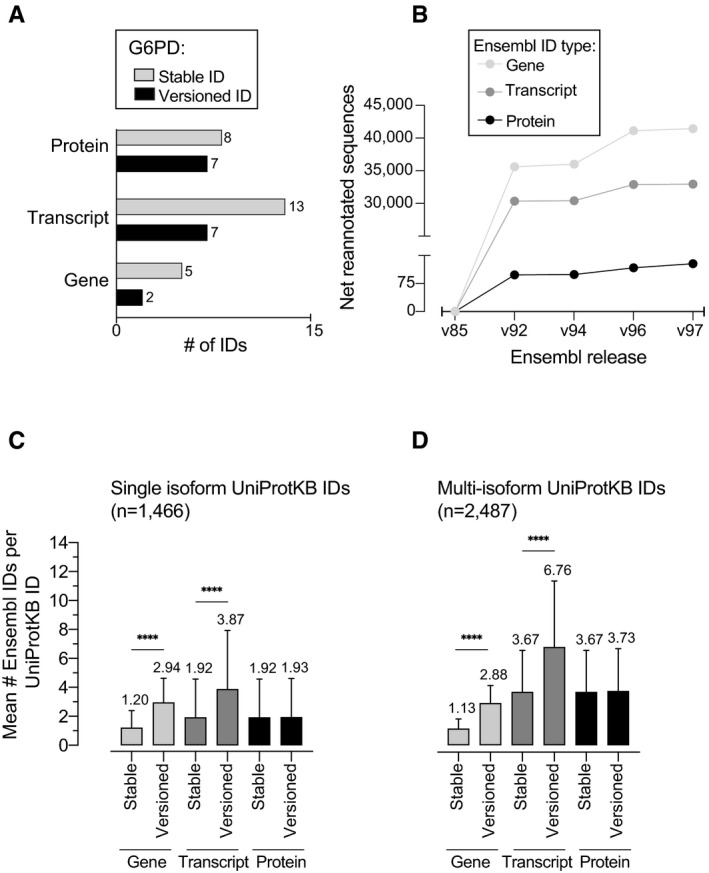
Figure EV1. Mapping of Ensembl IDs to UniprotKB shows heterogeneity at gene, transcript, and protein levels.

-
ANumber of stable and versioned Ensembl gene, transcript, and protein IDs for G6PD across all five Ensembl releases.
-
BCumulative sequence re‐annotations for Ensembl gene, transcript, and protein IDs since the v85 release.
-
C, DAverage number of Ensembl gene, transcript, and protein IDs for (C) single isoform (n = 1,466) and (D) multi‐isoform (n = 2,487) CpDAA UniProt entries. Bar plots represent mean values ± SD for the number of Ensembl IDs per stable UniProtKB ID. Statistical significance was calculated using an unpaired Student's t‐test, ****P‐value < 0.0001.
