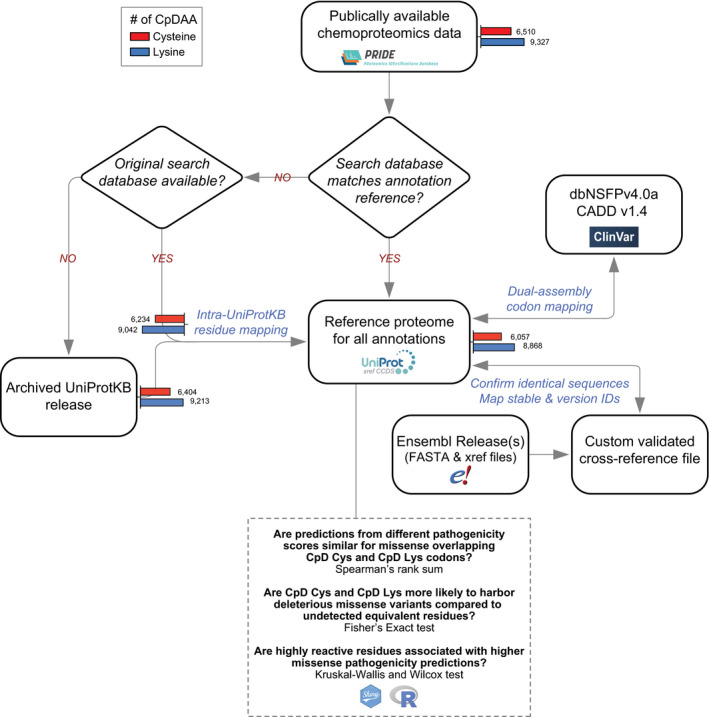
Figure EV2. Flowchart of the mapping strategy and data analysis.

CpD cysteines and lysines from three publicly available datasets were processed and filtered according to our optimized mapping pipeline. Number of CpD cysteines (red) and CpD lysines (blue) retained following each step shown as bar plots.
