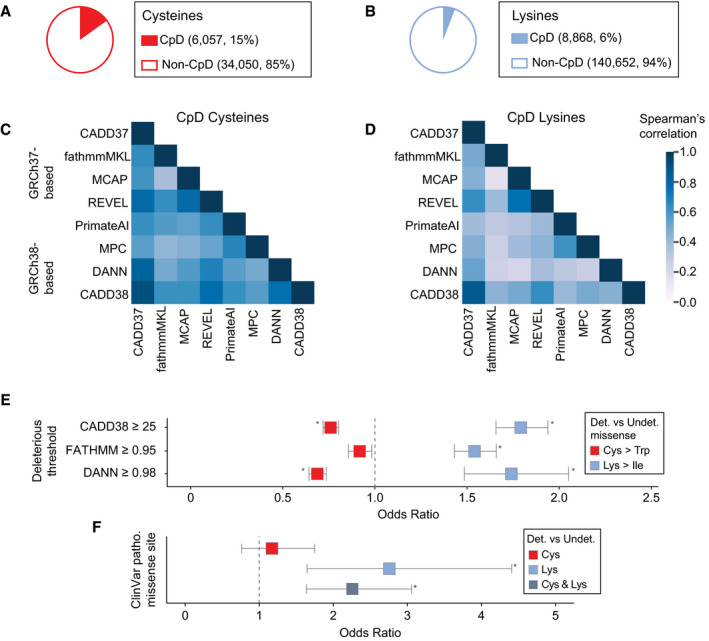
Figure 3. Analysis of pathogenic missense at detected vs undetected cysteines and lysines.

-
A, BAggregate number of detected and undetected cysteines (A) and lysines (B) in 3,840 CpDAA‐containing proteins.
-
CHeatmap of missense score correlations for all possible nonsynonymous SNVs at CpD cysteine (29,541 missense) for eight pathogenicity scores. Overall, Spearman's rank r was between 0.36 and 0.91.
-
DCpD Lysine (41,850 missense) heatmap for missense score correlations for all possible nonsynonymous SNVs. Spearman's rank r between 0.16 and 0.81.
-
EOdds of predicted deleterious Cys > Trp (red) missense at detected (n = 6,057) vs undetected (n = 34,049) residues in 3,840 detected proteins. Deleterious missense defined by CADD38, FATHMM, and DANN score thresholds (y axis). CADD38 OR = 0.76, P = 3.40e‐22; FATHMM OR = 0.92, P = 0.02; DANN OR = 0.690, P = 6.69e‐26. Odds of predicted deleterious Lys > Ile (blue) missense at detected (n = 3,581) vs undetected (n = 63,385) residues in 3,840 detected proteins. CADD38 OR = 1.80, P = 1.03e‐53; FATHMM OR = 1.55, P = 3.47e‐33; DANN OR = 1.75, P = 9.21e‐14. *P < 0.0042 Bonferroni‐adjusted (two‐tailed Fisher's exact test).
-
FOdds of ClinVar pathogenic variant overlapping detected (6,057 Cys; 8,868 Lys) vs undetected (34,050 Cys; 140,652 Lys) residues in 3,840 detected proteins. Cys detected in ClinVar pathogenic site (red, OR = 1.17, P = 0.457) and Lys detected at ClinVar Pathogenic site (light blue, OR = 2.76, P = 1.03e‐04). Combined Cys and Lys (dark blue, OR = 2.26, P = 9.99e‐07) *P < 0.0167 Bonferroni‐adjusted (two‐tailed Fisher's exact test).
Data information: In (E and F), 95% confidence intervals (line segments) and odds ratios (squares). In (C and D), color intensity represents two‐tailed Spearman's rank‐order correlation coefficients between 0 and 1.
