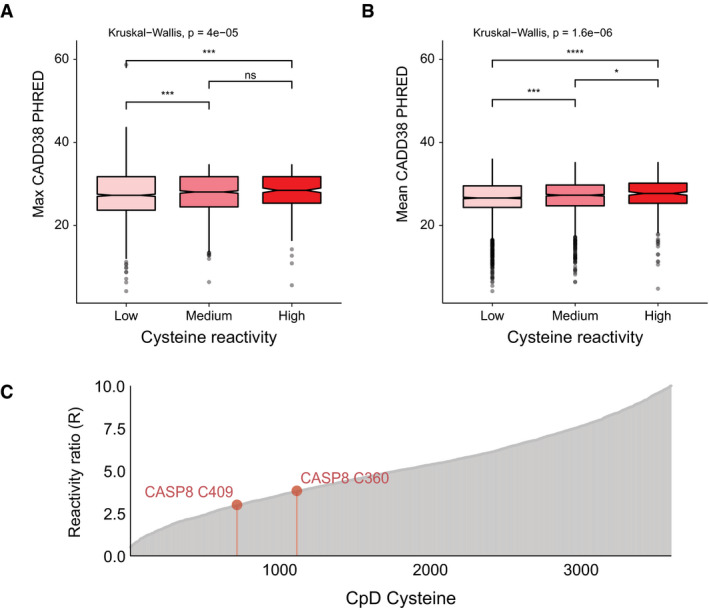
Association between cysteine reactivity labels and CADD38 (model for GRCh38) PHRED scores for cysteines of low (
n = 2,247), medium (
n = 1,448), and high (
n = 322) intrinsic reactivities, defined by isoTOP‐ABPP ratios, low (
R
10:1 > 5), medium (2 <
R
10:1 < 5), high (
R
10:1 < 2) (Weerapana
et al,
2010; Hacker
et al,
2017). Either the max CADD score for a missense change was assigned to the codon (BH‐adjusted
P‐values, low vs med ***
P. adj = 0.00099, low vs high ***
P. adj = 0.00086) (A) or the average of all missense scores at that codon (BH‐adjusted
P‐values, low vs med ***
P. adj = 4.0e‐04, med vs high *
P. adj = 0.023, low vs high ****
P. adj = 3.90e‐05) (B). Reactivity group differences assessed by Kruskal–Wallis nonparametric test and Wilcox test used for pairwise comparisons.