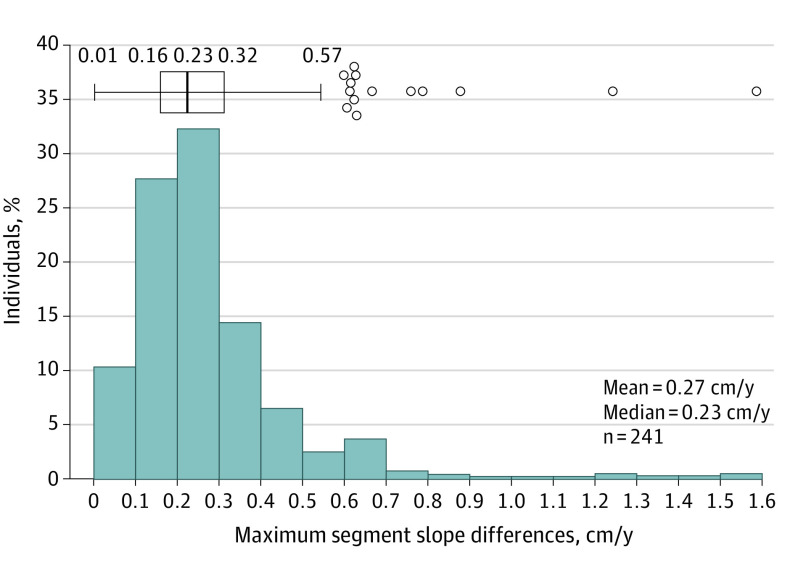
Figure 2. Distribution of Maximum Segment Slope Difference Supports Most Abdominal Aortic Aneurysms (AAAs) Grow Linearly.
Histogram and box plot distribution of maximum segment slope difference values for all patients with at least 3 computed tomography scans (n = 241). The maximum segment slope difference values for each patient measure the difference between the highest growth rate (centimeters per year) between 2 consecutive scans and the lowest growth rate between 2 consecutive scans. Shapiro-Wilk test for normal distribution showed data to be not normally distributed (P < .001). Low differences between slope segments in the majority of patients emphasize that linear modeling of maximum transverse diameter growth rates per patient is appropriate.

