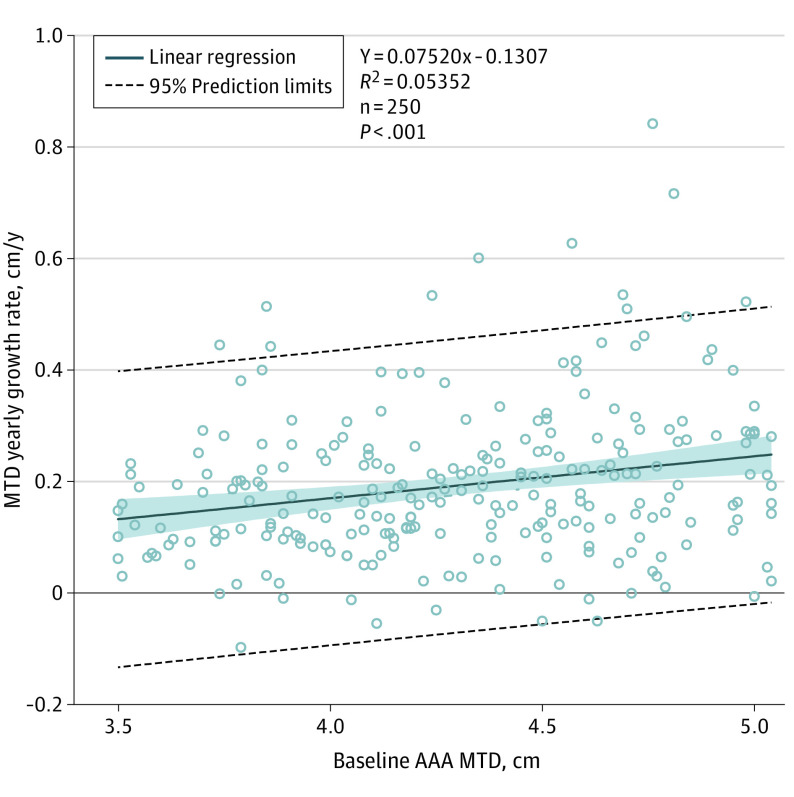
Figure 3. Association of Yearly Maximum Transverse Diameter (MTD) Growth Rates With Baseline Abdominal Aortic Aneurysm (AAA) Diameter.
Linear regressions were calculated for each patient based on measurement and study day. Patients were included if they had measurement data from at least 2 computed tomography scans (n = 250). Linear regression growth rates in centimeters per year are plotted vs baseline MTD in centimeters. The shaded blue area represents 95% confidence limits. Linear regression trendlines show a small but significant association between baseline aneurysm size and yearly growth rate.

