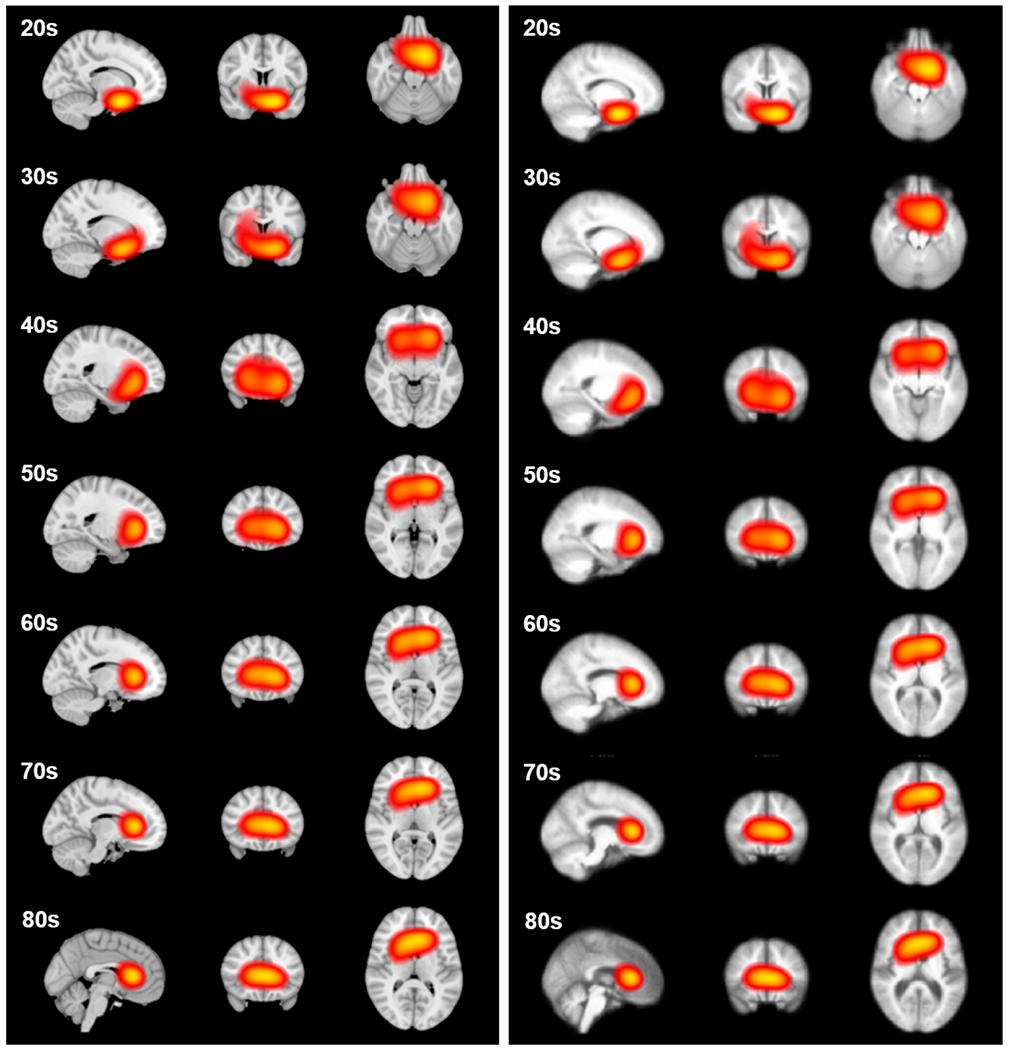
Figure 8:

The age activation maps at different age groups overlaid on the (Left) MNI152 template, and (Right) average T1w image within each age group, both with threshold at 0.8. Each slice is identified in the plane to identify the voxel of highest intensity.
