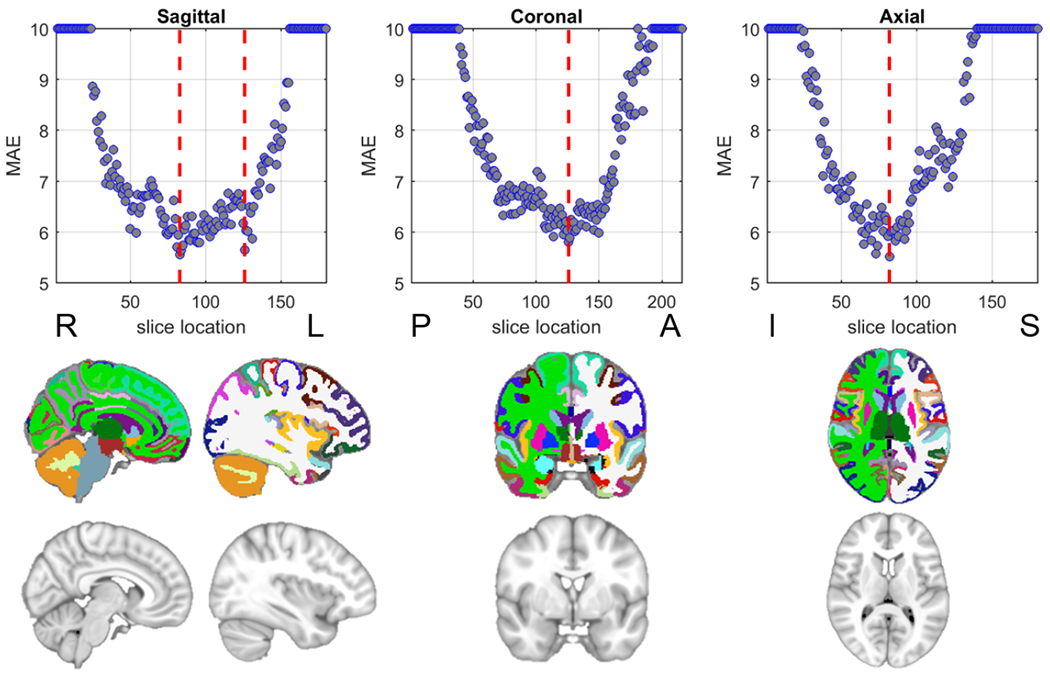
Figure 9:

MRI 2D slice based age estimation. (Top row) The mean absolute error (MAE) of the estimated age on the test set using 2D slices at different locations, the red lines indicate the location with lowest MAE. MAEs larger than 10 are capped to 10 for illustration purpose. (Bottom row) The illustration of slices at the red lines in the top row from the MNI152 template and the corresponding segmentation (the colors follow the FreeSurfer color lookup table).
