Figure 2.

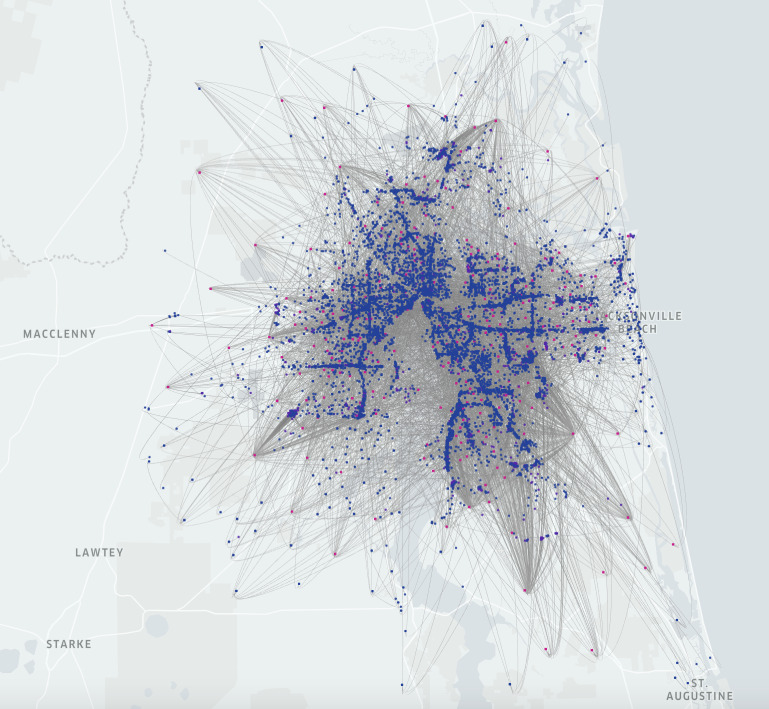
Mapped CBG-POI movement network for the week of 27 January 2020, in Jacksonville, Florida. The figure shows a total of 83 661 weighted edges. Red nodes represent hotspots (1314 nodes) and blue nodes represent non-hotspots (10 820 nodes).

Mapped CBG-POI movement network for the week of 27 January 2020, in Jacksonville, Florida. The figure shows a total of 83 661 weighted edges. Red nodes represent hotspots (1314 nodes) and blue nodes represent non-hotspots (10 820 nodes).