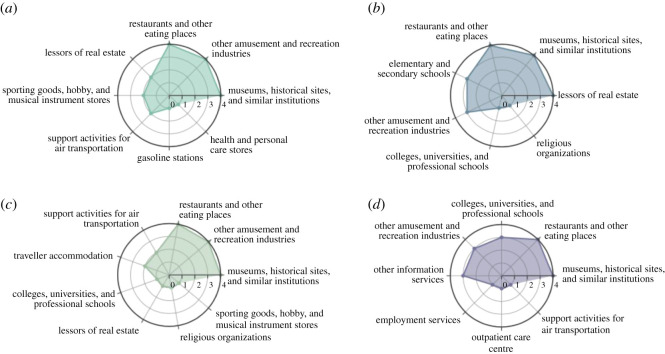
Figure 7.
POIs with significant flux-in changes in the four one-week periods: (a) New York, (b) Austin, (c) San Francisco and (d) Seattle. We included top five businesses related to hotspot POIs with significant flux-in changes in each week. The indicator on the radar chart refers to the number of weeks the business activity was in the top five affected POIs.

