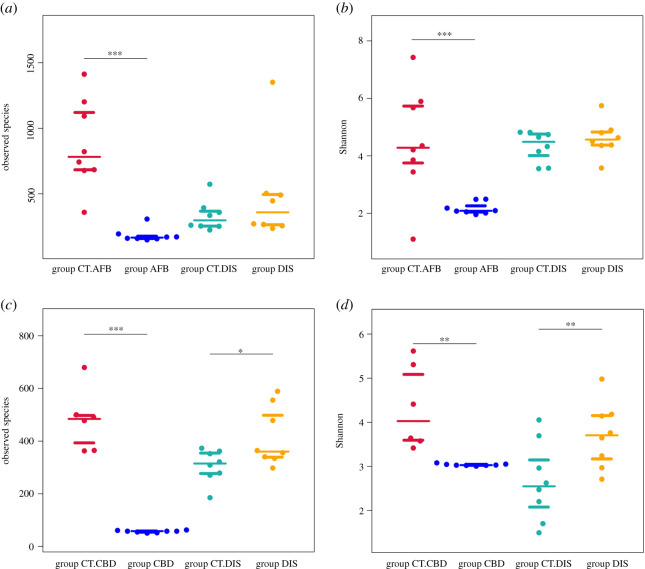
Figure 2.
Plot of mean alpha-diversity for different groups. Community richness and diversity is characterized by the observed species and the Shannon index, respectively. (a,b) Bacterial communities. (c,d) Fungal communities. Asterisks indicate a significant difference between groups from the same apiary. *p < 0.05, **p < 0.01, ***p < 0.001.

