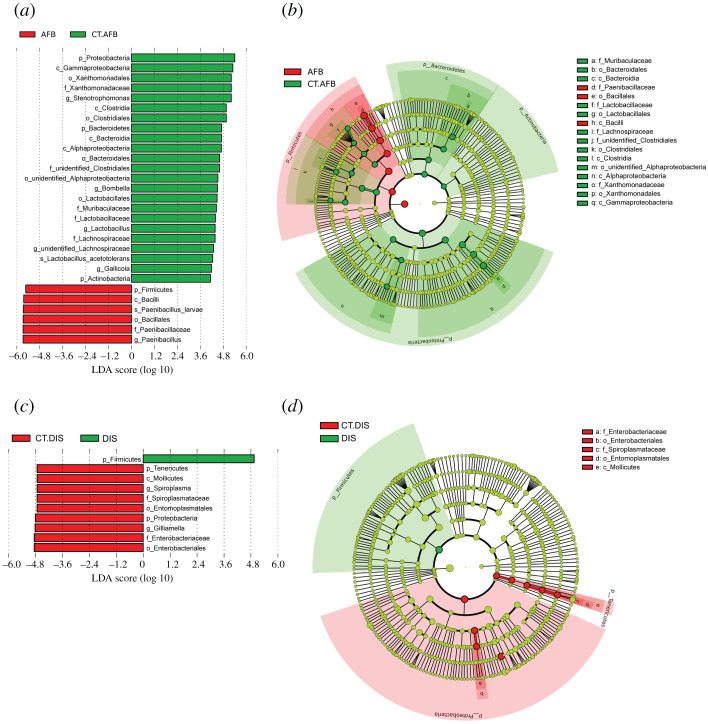
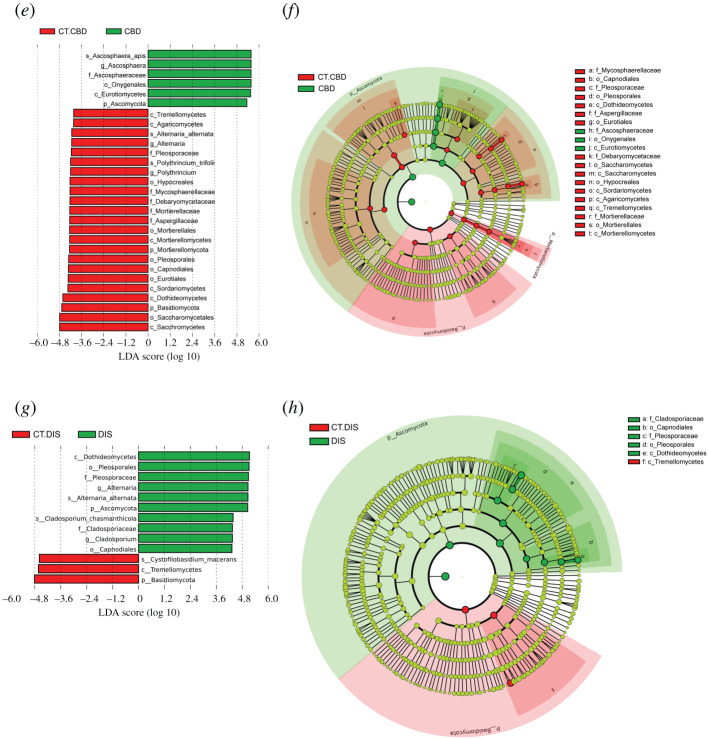
Figure 3.
Significantly different taxa between groups from the same apiary identified by LEfSe. (a, c, e and g) LefSe analysis (the threshold of the LDA score was 4.0). (b, d, f and h) Taxonomic cladogram based on the results of LEfSe analysis. The size of the circles was based on relative abundance. Yellow represents no significant difference in taxa; green and red represent significantly different taxa in the correspondingly colour-labelled groups. Only taxa with greater than 0.1% proportional abundance are visualized. (a, b, c, d), based on 16S rRNA sequencing data. (e, f, g, h), based on ITS sequencing data.


